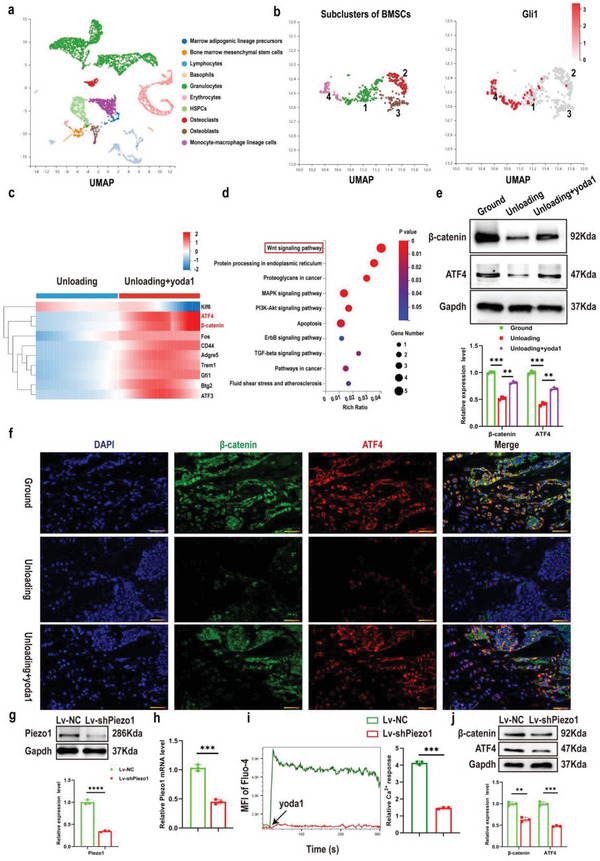
Figure 4.

Expression of both β‐catenin and its downstream target gene ATF4 was increased in Gli1+ BMSCs after Piezo1 activation. a) Colored UMAP plot created using pooled data from 10 cell clusters from bone marrow‐derived cells isolated from unloading and unloading + yoda1 mice by single‐cell transcriptomics. The name of each cell cluster is shown on the right. b) Among the four subclusters of BMSCs, the expression level of Gli1 was higher in subclusters 1 and 4 compared to subclusters 2 and 3. c) Heatmap generated from scRNA‐seq depicting the differentially‐expressed genes (DEGs) in Gli1+BMSCs between unloading and unloading + yoda1 groups. d) KEGG pathway analysis of DEGs. e) Western blot analysis of β‐catenin and ATF4 protein expression levels in the indicated Gli1+ BMSCs. Mean ± SD, n = 3 in each group. **p < 0.01, ***p < 0.001. f) Representative β‐catenin (green) and ATF4 (red) co‐immunostaining images of distal femurs at week 4 post‐hindlimb unloading. Scale bar = 50 µm. g) Western blot analysis of Piezo1 protein level in Gli1+ BMSCs after transfection with NC or Lv‐shPiezo1 for 36 h. Mean ± SD, n = 3 in each group. ****p < 0.0001. h) RT‐PCR analysis of Piezo1 mRNA in Gli1+ BMSCs after transfection with NC or Lv‐shPiezo1 for 36 h. Mean ± SD, n = 3 in each group. ***p < 0.001. i) Representative images showing calcium influx of Gli1+ BMSCs stimulated by yoda1 (10 µM) changed over time (left). Cells were transfected with Lv‐NC or Lv‐shPiezo1 for 36 h. The changes in fluorescent intensity of Gli1+ BMSCs were quantified (right). Mean ± SD, n = 3 in each group. ***p < 0.001. j) Western blot analysis of β‐catenin and ATF4 protein expression levels when Piezo1 was knocked down. Mean ± SD, n = 3 in each group. **p < 0.01, ***p < 0.001.
