Figure 7.

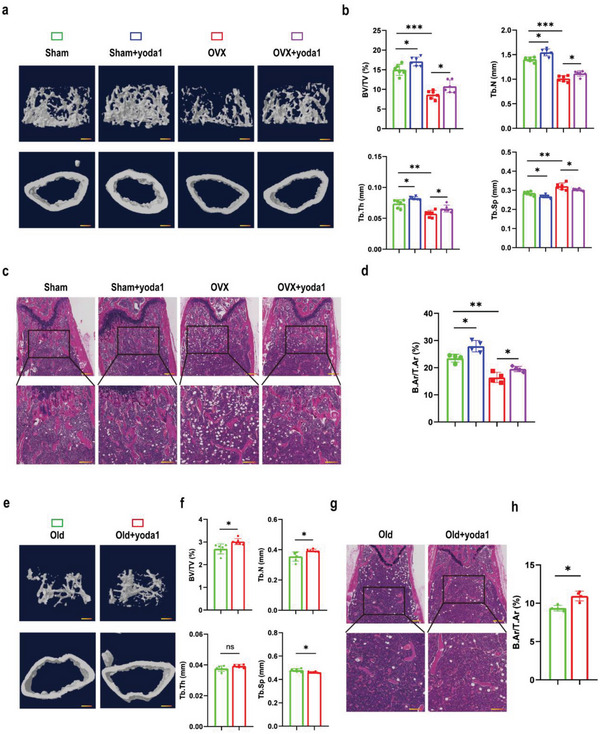
Activation of Piezo1 slightly but significantly rescued bone loss in OVX and aged mouse models. a, e) Representative 3D trabecular architecture and cortical bone images based on micro‐CT reconstruction of the distal femurs at week 4 after the OVX (a) and aged (e) groups of mice indicated after the administration of yoda1. Scale bar = 500 µm. b, f) Comparative analysis of the bone parameters BV/TV, TB.N, TB.TH and TB.SP in the distal femurs from the OVX (n = 6 in each group) (b) and aged (n = 6 in each group) (f) groups of mice indicated at week 4. *p < 0.05, **p < 0.01, ***p < 0.001, ns = no significant difference. c, g) Representative H&E staining images of distal femurs from the OVX (n = 4 in each group) (c) and aged (g) (n = 4 in each group) groups of mice indicated at week 4. Boxed areas are shown magnified in the panel below. Scale bar = 500 µm (upper image); 100 µm (lower image). d, h) Quantitative analysis of B.Ar/T.Ar ratios in distal femurs from the OVX (d) and aged (h) groups of mice indicated at week 4. Mean ± SD, n = 4 in each group. *p < 0.05, **p < 0.01. B.Ar = bone area; T.Ar = total area.
