
Figure 4.
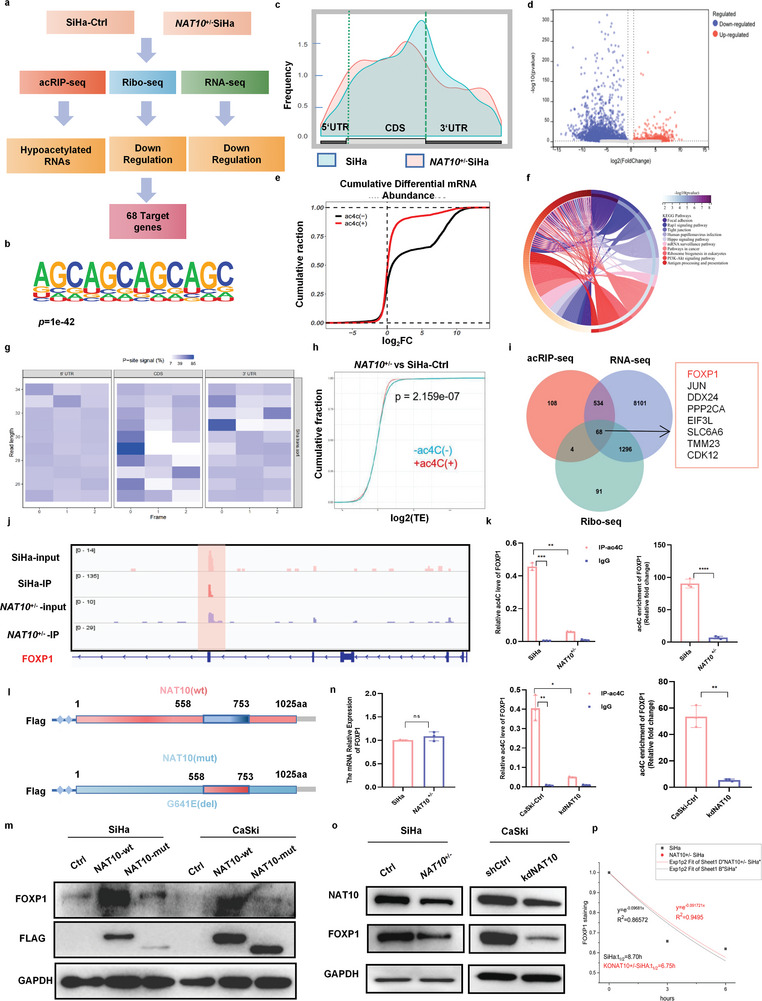
FOXP1 is the target of NAT10 for ac4C modification, and its translation efficiency is enhanced by NAT10 in an ac4C‐dependent manner. a) Flow chart of the screening and validation of the correlation between the expression of NAT10 and that of its downstream target FOXP1. b) The ac4C motif detected by MEME motif analysis of acRIP‐seq data. c) The distribution of acetylated peaks on mRNA. d) Volcano plot showing the change in the ac4C level on mRNA after NAT10 knockdown in SiHa cells. e) Cumulative distribution function plot showing differential expression of ac4C(–) and ac4C(+) transcripts in NAT10 +/−SiHa versus Ctrl cells. f) KEGG analysis results showing the pathway enrichment of genes with different ac4C levels. g) Heatmap showing the reading frame (RF) distribution in the annotated gene region. h) CDF plots of mRNA‐normalized ribosome footprint reads for ac4C(+) transcripts and ac4C(‐) transcripts in NAT10 +/− SiHa versus control cells. i) Venn diagram showing the target genes with changes in ac4C acetylation, modification, transcription and translation levels after NAT10 knockdown. j) IGV software was used to visualize the peaks with ac4C enrichment in Ctrl and NAT10 +/‐ SiHa cells. k) The acRIP‐qPCR assay revealed the ac4C abundance on FOXP1 mRNA in Ctrl and NAT10 +/− SiHa cells. l) Schematic showing the mutation site (del 558–753aa) in the NAT10‐mut vector and the NAT10‐wt vector. m) Western blot analysis was performed to measure the expression of Flag‐NAT10 and FOXP1 in CCa cells transfected with control, Flag‐NAT10‐wt or Flag‐NAT10‐mut plasmids for 48 h. n,o) mRNA (n) and protein (o) levels of FOXP1 in Ctrl and NAT10 +/‐ SiHa cells. p) The half‐life (t1/2) of FOXP1 mRNA remained unchanged after treatment with Act D for 0, 3, or 6 h in NAT10 +/‐ and SiHa cells. The data are shown as the means ± SDs; *p<0.05; **p<0.01; *** p<0.001; **** p<0.0001; ns, nonsignificant.