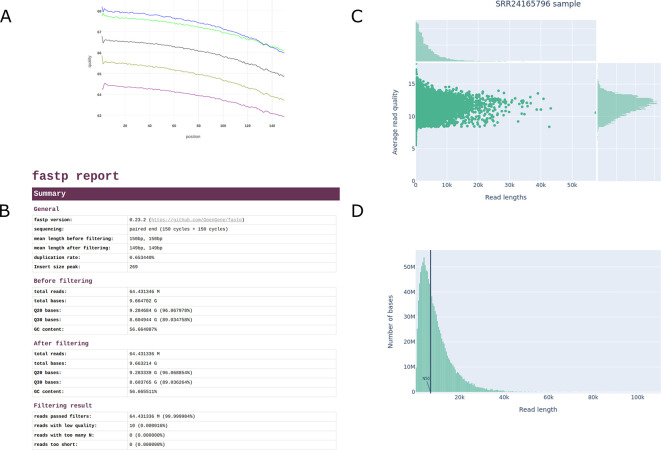
Figure 5. Overview of typical QC outputs generated by the ngs-preprocess pipeline.
Figures A and B are generated by the fastp tool and display the base quality of one of the short-read pairs and the summary of reads statistics, respectively. Figures C and D are generated by the NanoPlot tool and display the average read quality per read length and the weighted read length histogram, respectively.

