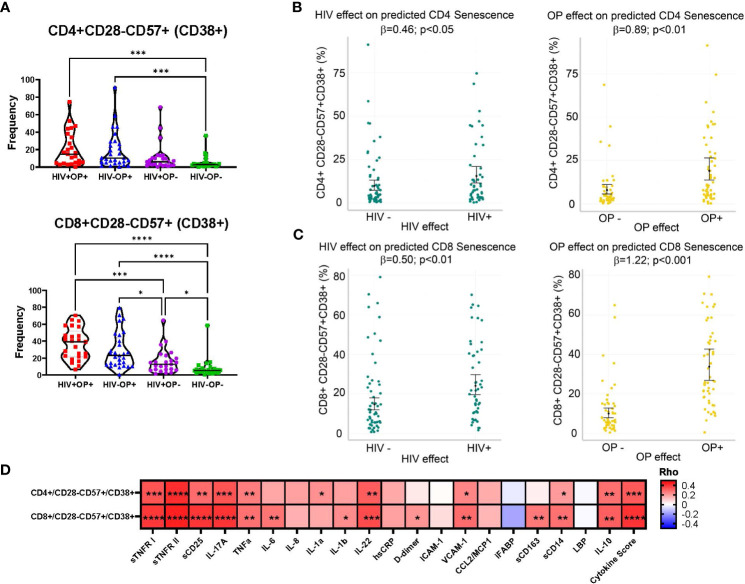
Figure 3.
CD38 expressing terminally differentiated senescent-like T cells are highly expressed in populations with opioid use. (A) Violin plots by participant group with mean and SEM confidence intervals for frequencies of CD28-CD57+CD38+ in CD4 and CD8 T cells. Nonparametric Kruskal Wallis test was corrected for multiple comparisons by controlling the FDR (original FDR method of Benjamini and Hochberg). Red represents HIV+OP+ (n=25), Blue represents HIV-OP+ (n=29), Purple represents HIV+OP- (n=25), Green represents HIV-OP- (n=26). Adjusted p-values: ****p<0.0001, ***p<0.001, **p<0.01, *p<0.05. (B, C) Scatter dot plots with mean and SEM values. Visualization of adjusted predictions for effects of HIV status and OP use status (while holding other covariates constant) from negative binomial regression models used to predict CD28-CD57+CD38+ in CD4 (B) and CD8 (C) in T cells (see Table 4 for regression details). (D) Spearman correlation matrix of 20 individual normalized cytokines and normalized cytokine score with CD28-CD57+CD38+ expression on CD4 and CD8 T cells. Adjusted p-values: ****p<0.0001, ***p<0.001, **p<0.01, *p<0.05, indicate significant correlation between two variables in the box.

