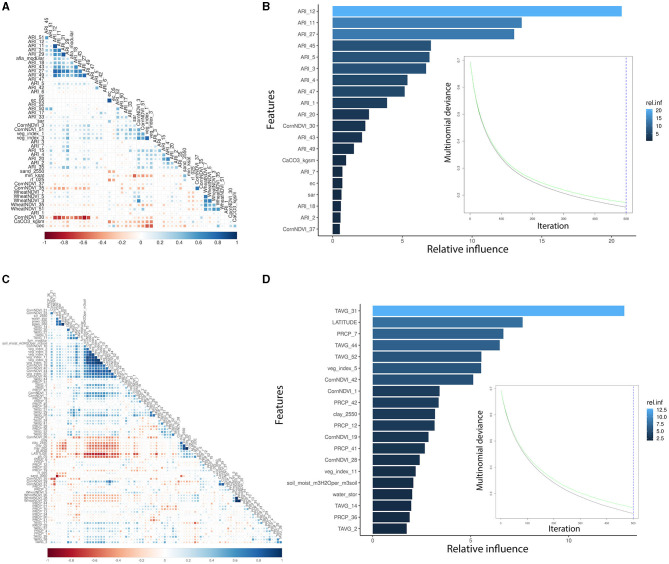
Figure 1.
Pair-wise correlation analysis of the significant input variables influencing GBM and summary of the GBM model using multinomial mycotoxin outcome. (A) Correlation analysis of the features used for AFL modeling; (B) top 20 influential input features and their relative influence over the model in the prediction of AFL; (C) correlation analysis of the features used for FUM modeling; (D) top 20 influential input features and their relative influence over the model in the prediction of FUM. The correlation is depicted from positive (blue) to negative (red), with blank squares representing non-significant p-values of correlation between variables. For the correlation analysis, the p-value cutoff was 0.05, and the confidence level was 0.95. The blue hue in GBM plots represents the relative influence of the input variables, with light blue high and dark blue low influence levels. The green line is the testing set multinomial deviance loss, the black line is the training set multinomial deviance loss, and the blue dotted vertical line is the number of iterations used.

