. 2023 Oct 4;83(22):3681–3692. doi: 10.1158/0008-5472.CAN-23-0398

Figure 2.

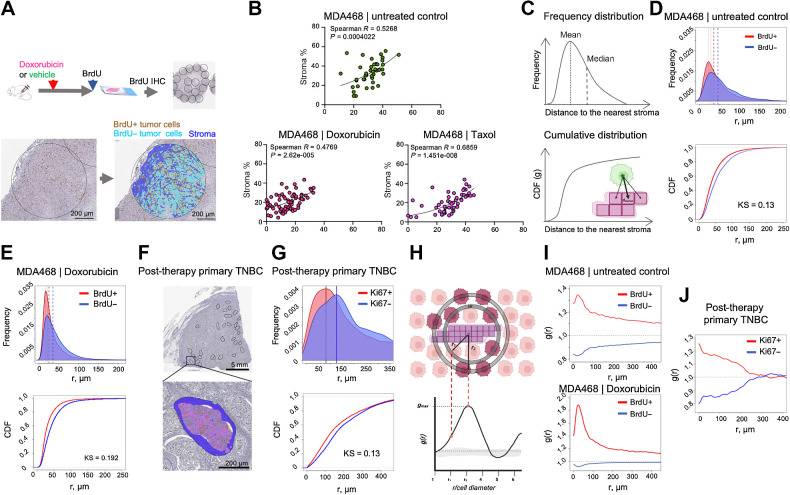
Figure 2. Proximity to stroma correlates with higher proliferation in vivo. A, Diagram of the experimental approach to assess the impact of stroma proximity on the proliferation of TNBC cells in vivo. Before euthanasia, the mice were pulsed with BrdU, which enabled IHC-based detection of cells in the S-phase of the cell cycle. Tumor tissue in whole slide scans of BrdU IHC staining was subsampled into smaller areas (0.9 mm in diameter); necrosis-free tumor tissue within these subsampled regions was segmented into BrdU± tumor cells and stroma. B, Regression analyses of MDA468 xenograft tumors, treated with doxorubicin (2.5 mg/kg), Taxol (10 mg/kg), or vehicle control 48 hours before euthanasia were used to assess the correlation between stromal content and tumor cell proliferation. Each dot represents a subsampled ROI, as in A. Spearman R and P values of nonlinear fit are shown. C, Schemata for the nearest neighbor analyses that calculate distances between each of BrdU± cells in the tumor cross-section and the nearest stromal pixel. D and E, Frequency distribution and cumulative distribution function (CDF) plots of distances to the nearest stroma of BrdU± cells in MDA468 xenografts tumors from control (D) and doxorubicin-treated (E) mice. Dashed lines indicate medians and means of the distributions KS denote the Kolmogorov-Smirnov statistical test. F, A representative image of a diagnostic biopsy of a post-treatment primary human TNBC tumor, stained with proliferation marker Ki67, ROIs used for subsampling, and an example segmentation of an ROI into Ki67± cells and stroma. G, Frequency distribution and CDF plots of distances of Ki67± cells to the nearest stroma in the primary TNBC sample. H Schemata for the RDF analysis. I, RDF analyses of the impact of stroma proximity on the distribution of BrdU± cells in control and doxorubicin-treated MDA468 tumors. J, RDF analyses of the impact of stroma proximity on the distribution of Ki67± cells in a post-treatment primary TNBC tumor. (A, C, and H, Created with BioRender.com.)

Proximity to stroma correlates with higher proliferation in vivo. A, Diagram of the experimental approach to assess the impact of stroma proximity on the proliferation of TNBC cells in vivo. Before euthanasia, the mice were pulsed with BrdU, which enabled IHC-based detection of cells in the S-phase of the cell cycle. Tumor tissue in whole slide scans of BrdU IHC staining was subsampled into smaller areas (0.9 mm in diameter); necrosis-free tumor tissue within these subsampled regions was segmented into BrdU± tumor cells and stroma. B, Regression analyses of MDA468 xenograft tumors, treated with doxorubicin (2.5 mg/kg), Taxol (10 mg/kg), or vehicle control 48 hours before euthanasia were used to assess the correlation between stromal content and tumor cell proliferation. Each dot represents a subsampled ROI, as in A. Spearman R and P values of nonlinear fit are shown. C, Schemata for the nearest neighbor analyses that calculate distances between each of BrdU± cells in the tumor cross-section and the nearest stromal pixel. D and E, Frequency distribution and cumulative distribution function (CDF) plots of distances to the nearest stroma of BrdU± cells in MDA468 xenografts tumors from control (D) and doxorubicin-treated (E) mice. Dashed lines indicate medians and means of the distributions KS denote the Kolmogorov-Smirnov statistical test. F, A representative image of a diagnostic biopsy of a post-treatment primary human TNBC tumor, stained with proliferation marker Ki67, ROIs used for subsampling, and an example segmentation of an ROI into Ki67± cells and stroma. G, Frequency distribution and CDF plots of distances of Ki67± cells to the nearest stroma in the primary TNBC sample. H Schemata for the RDF analysis. I, RDF analyses of the impact of stroma proximity on the distribution of BrdU± cells in control and doxorubicin-treated MDA468 tumors. J, RDF analyses of the impact of stroma proximity on the distribution of Ki67± cells in a post-treatment primary TNBC tumor. (A, C, and H, Created with BioRender.com.)