. 2023 Oct 9;83(22):3796–3812. doi: 10.1158/0008-5472.CAN-23-0385

Figure 2.

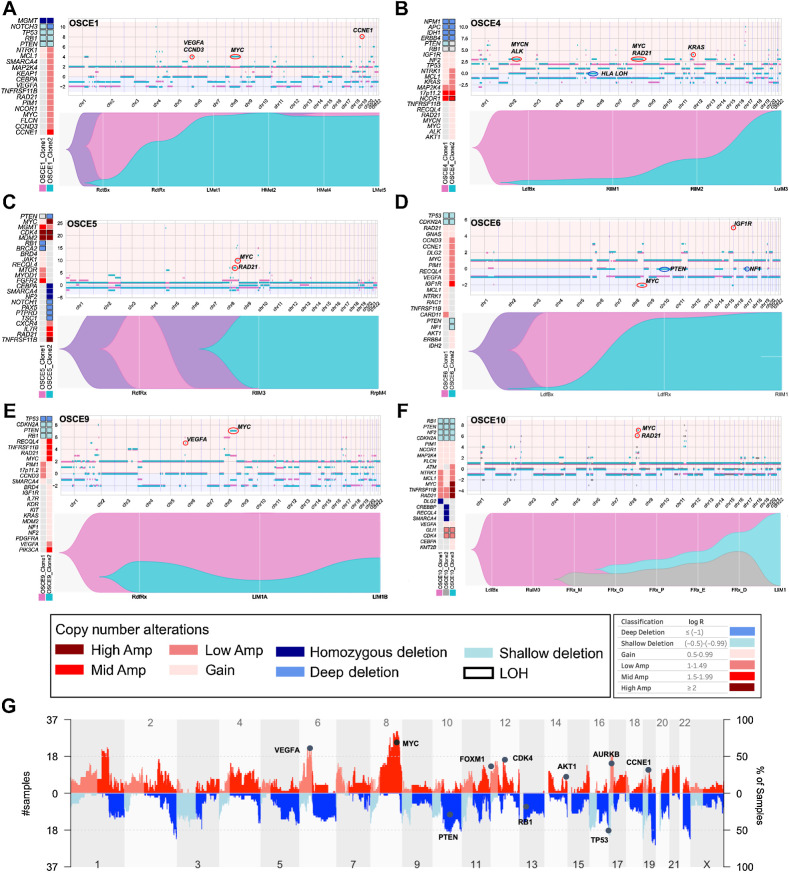
Figure 2. Subclonal copy-number clones emerge at relapse. A–F, For each patient there is a panel of three figures. The figure on the left is an oncoprint featuring clone-specific CNAs in recurrently altered genes of interest in osteosarcoma. The top figure is a plot of allele-specific CNAs for each clone, with significant events for each clone circled and highlighted (note y-axis scales are unique for each patient). Clone 1, magenta clone; clone 2, teal clone; clone 3 in OSCE10, gray clone. The major allele is plotted above 0 and the minor allele is plotted below 0. The bottom figure in each panel is a TimeScape plot of the prevalence of each clone at different time points throughout a patient's disease course. G, Combined genome-wide CNAs across all patients in the cohort, with recurrently altered genes highlighted.

Subclonal copy-number clones emerge at relapse. A–F, For each patient there is a panel of three figures. The figure on the left is an oncoprint featuring clone-specific CNAs in recurrently altered genes of interest in osteosarcoma. The top figure is a plot of allele-specific CNAs for each clone, with significant events for each clone circled and highlighted (note y-axis scales are unique for each patient). Clone 1, magenta clone; clone 2, teal clone; clone 3 in OSCE10, gray clone. The major allele is plotted above 0 and the minor allele is plotted below 0. The bottom figure in each panel is a TimeScape plot of the prevalence of each clone at different time points throughout a patient's disease course. G, Combined genome-wide CNAs across all patients in the cohort, with recurrently altered genes highlighted.