. 2023 Oct 9;83(22):3796–3812. doi: 10.1158/0008-5472.CAN-23-0385

Figure 5.

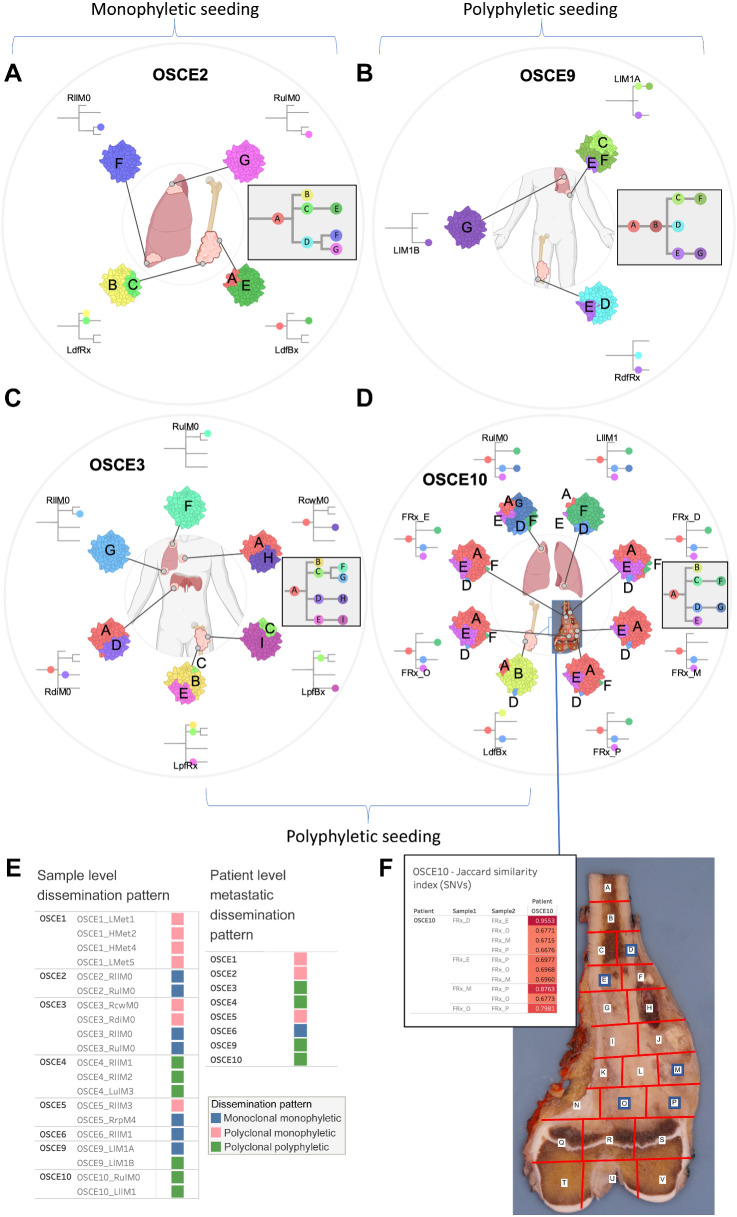
Figure 5. SNV-based phylogenies highlighting spatial evolution and descriptions of metastatic seeding patterns at the sample and patient level. A–D, Spatially and in some cases temporally distinct samples are indicated on the anatomic sites from where the sample originated. The colors represent different clones, and the phylogenetic trees show the evolutionary relationships between these clones. The prevalence of each clone at a particular site is proportional to the colored area of the cellular aggregate representation. E, Sample and patient level dissemination patterns are characterized in these charts. Monoclonal dissemination: single subclone within the primary tumor seeds one or more metastatic lesions; polyclonal dissemination: multiple distinct subclones from the primary tumor seed one or more metastatic lesions; monophyletic origin: all metastatic clones are derived from a recent common ancestor; polyphyletic origin: metastasizing clones are more similar to other subclones within the primary tumor than they are to each other. These descriptions can be considered at the sample level, focused on the clonal make up of a single metastatic site compared with the primary tumor, or taken as a whole, evaluating all spatially or temporally separated samples and how they relate back to the primary tumor. F, Multiregion sequencing was performed on a primary resection sample from OSCE10. Regions D, E, M, O, P were sequenced from the specimen grid depicted. A table of Jaccard similarity indexes based on shared SNVs for these samples is shown in the top left inset. (A–D, Created with BioRender.com.)

SNV-based phylogenies highlighting spatial evolution and descriptions of metastatic seeding patterns at the sample and patient level. A–D, Spatially and in some cases temporally distinct samples are indicated on the anatomic sites from where the sample originated. The colors represent different clones, and the phylogenetic trees show the evolutionary relationships between these clones. The prevalence of each clone at a particular site is proportional to the colored area of the cellular aggregate representation. E, Sample and patient level dissemination patterns are characterized in these charts. Monoclonal dissemination: single subclone within the primary tumor seeds one or more metastatic lesions; polyclonal dissemination: multiple distinct subclones from the primary tumor seed one or more metastatic lesions; monophyletic origin: all metastatic clones are derived from a recent common ancestor; polyphyletic origin: metastasizing clones are more similar to other subclones within the primary tumor than they are to each other. These descriptions can be considered at the sample level, focused on the clonal make up of a single metastatic site compared with the primary tumor, or taken as a whole, evaluating all spatially or temporally separated samples and how they relate back to the primary tumor. F, Multiregion sequencing was performed on a primary resection sample from OSCE10. Regions D, E, M, O, P were sequenced from the specimen grid depicted. A table of Jaccard similarity indexes based on shared SNVs for these samples is shown in the top left inset. (A–D, Created with BioRender.com.)