
Figure 4. Combined loss of TNFR1 and RIPK1 kinase activity prolongs the lifespan of cIap1 MutR /MutR /cIap2 MutR/MutR animals.
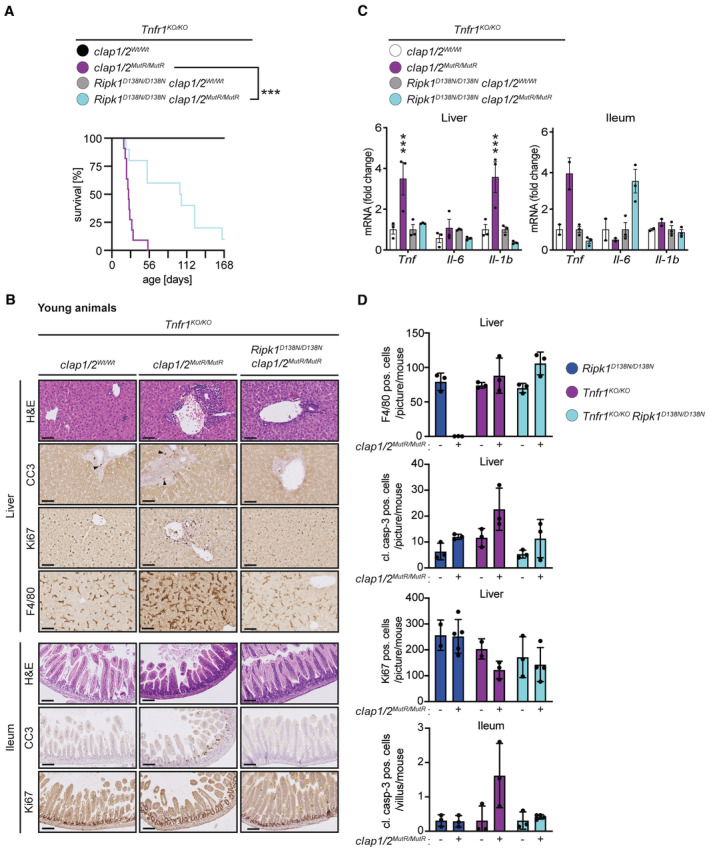
- Kaplan–Meier survival curves of Tnfr1 KO/KO /cIAP1/2 Wt/Wt (n = 7), Tnfr1 KO/KO /cIap1/2 MutR/MutR (n = 11), Tnfr1 KO/KO /Ripk1 D138N/D138N /cIAP1/2 Wt/Wt (n = 10) and Tnfr1 KO/KO /Ripk1 D138N/D138N /cIap1/2 MutR/MutR (n = 10) mice. P‐values were calculated with a log‐rank (Mantel‐Cox) test.
- Representative images of liver and ileum sections from mice at 2 weeks of age. Scale bars: 50 μm. Sections were stained with Hematoxylin and Eosin (H&E), cleaved caspase‐3 (CC3), Ki67, or F4/80. Arrowheads indicate CC3‐positive staining.
- Relative mRNA expression of the indicated genes from liver and ileum measured by qPCR. For ileal tissue samples 2 mice per genotype from Tnfr1 KO/KO /cIAP1/2 Wt/Wt and Tnfr1 KO/KO /cIap1/2 MutR/MutR and 3 mice per genotype from Tnfr1 KO/KO /Ripk1 D138N/D138N /cIAP1/2 Wt/Wt and Tnfr1 KO/KO /Ripk1 D138N/D138N /cIap1/2 MutR/MutR were measured.
- Quantification of cells positive for cleaved caspase‐3 (CC3), Ki67, or F4/80 staining in liver and ileum sections of mice.
Data information: In (C), bars represent mean ± SEM of three mice per genotype for liver samples. P‐values were calculated using two‐way ANOVA followed by Bonferroni postanalysis and significance is visualised in comparison with Tnfr1 KO/KO controls. In (D), each data point represents one mouse and bars indicate mean ± SD. ***P < 0.001.
Source data are available online for this figure.