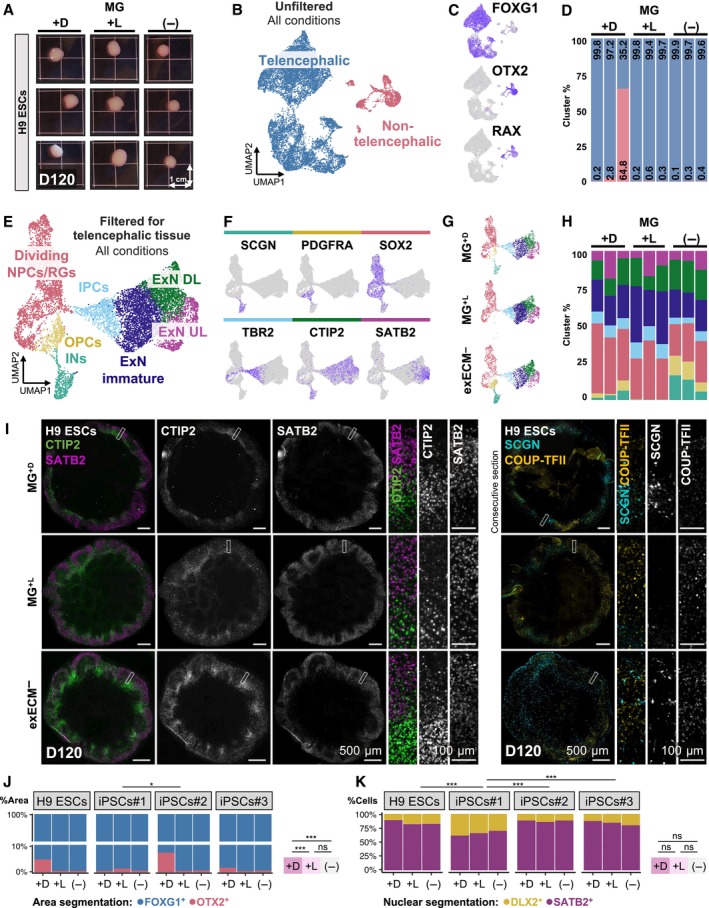
Figure 5. Long‐term organoid culture produces comparable cell types across conditions.

-
ANine H9‐derived organoids used for scRNAseq analysis at D120.
-
B, CUMAP projection of cells isolated from each organoid identifies two main clusters: FOXG1+ telencephalic cells; and OTX2+RAX+ non‐telencephalic cells (all conditions shown).
-
DNon‐telencephalic cells derive mainly from one MG+D organoid, making up over 60% of the tissue.
-
E, F(E) UMAP projection after filtering and exclusion of non‐telencephalic clusters allows the identification of 8 clusters, including dividing NPCs/radial glia progenitors (RGs), oligodendrocyte precursor cells (OPCs), interneurons (INs), intermediate progenitor cells (IPCs), immature excitatory neurons (ExN), deep‐layer excitatory neurons (ExNs DL), and upper‐layer ExNs (ExNs UL), marked by cell‐type specific marker genes (F) (all conditions shown).
-
GUMAP projection of telencephalic cells, split by condition.
-
HPercentage of telencephalic cells per cluster and per organoid.
-
ITissue immunostaining of organoids at D120 shows abundant deep‐ and upper‐layer neurons (CTIP2+ and SATB2+, respectively) with rudimentary layer organization, as well as less abundant populations of interneurons (SCGN+ and COUP‐TFII+).
-
J, KQuantification of the ratio of telencephalic/non‐telencephalic (FOGX1+/OTX2+) (J) and dorsal/ventral (SATB2+/DLX2+) (K) tissue in 98 organoids at D120 (see results for individual organoids of all cell lines in Appendix Fig S16). Statistical tests are analysis of variance (ANOVA); 0 ≤ P < 0.001, ***; 0.01 ≤ P < 0.05, *; P ≥ 0.05, ns (see results of statistical tests in Appendix Table S1).
Source data are available online for this figure.
