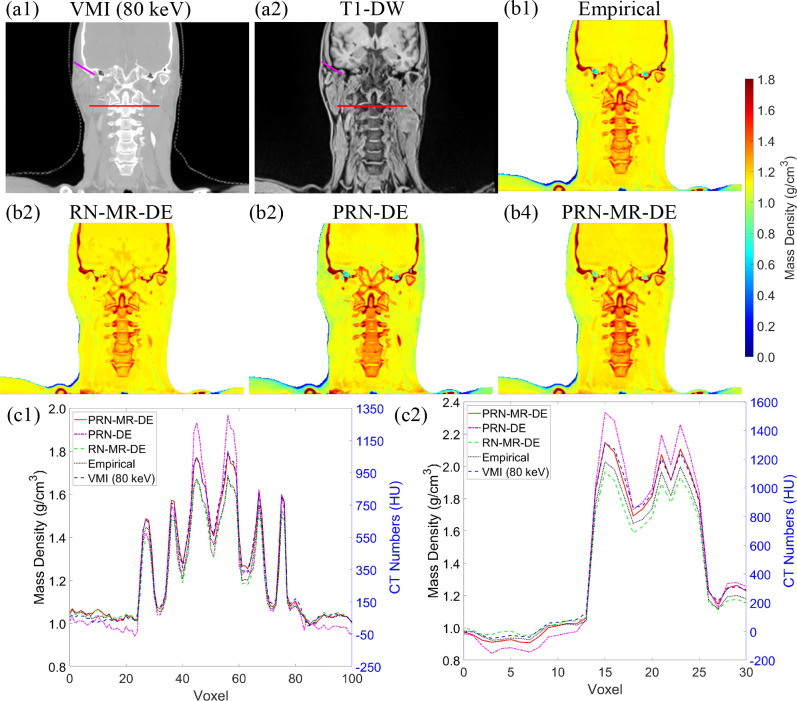
Figure 4.
Images from (a1) 80-keV VMI and (b1) T 1DW for the same patient. Mass density maps of a patient from an HN site generated by (b1) the empirical model (Eq. (8)), (b2) conventional ResNet trained by MRI and DECT (RN-MR-DE) images, (b3) PRN trained by DECT (PRN-DE) images, and (b4) PRN trained by MRI and DECT (PRN-MR-DE) images. (c1) The line profile of the red line from (a1)–(a2). (c2) The line profile of the purple line from (a1)–(a2). DECT, dual energy CT; PRN, physics-constrained ResNet; VMI, irtual monochromatic image; T 1DW, T 1 weighted Dixon water-only

