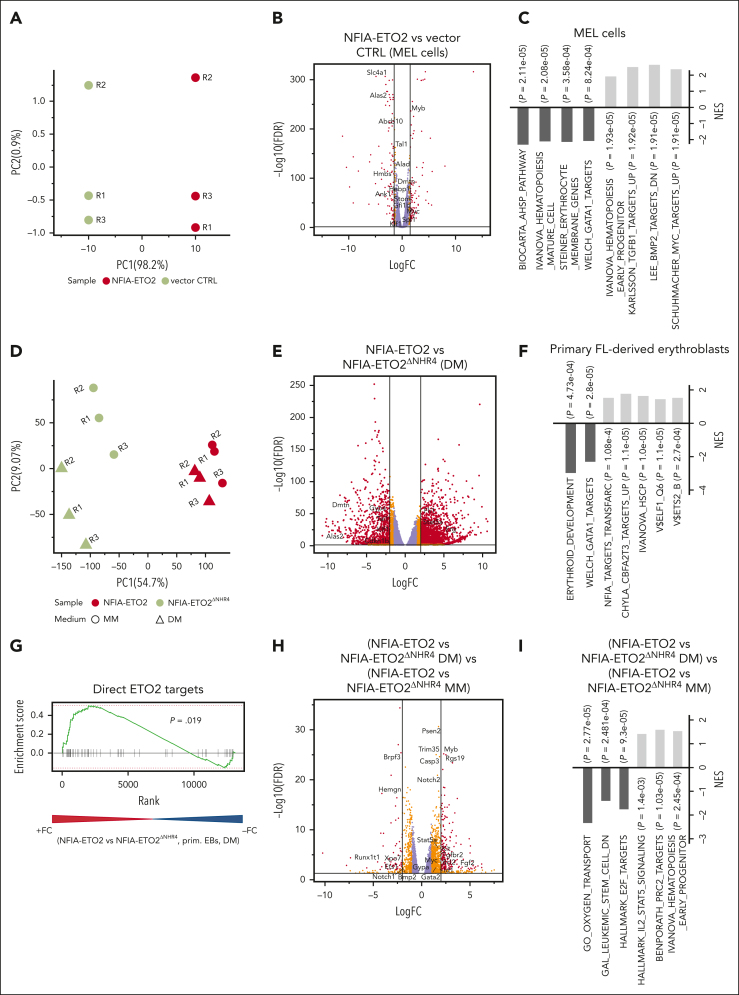
Figure 2.
Reduced expression of master regulators of erythroid differentiation in NFIA-ETO2+ MEL cells and primary EBs. (A) PCA of the gene expression signatures of NFIA-ETO2–expressing MEL cells compared with CTRL cells grown for 2 days in 2% DMSO. Each point represents 1 sample, colored for NFIA-ETO2 (red) or CTRLs (olive). (B) Volcano plot showing DEGs from the NFIA-ETO2 and CTRL MEL cells grown for 2 days in 2% DMSO (FDR <0.05; logFC >±1.5 black lines). Red and orange points represent statistically significant dysregulated genes (FDR < 0.05; logFC >±1.25 or 1.5 respectively), whereas purple points represent nonsignificantly regulated genes. (C) Selected positive and negative GSEA enrichment scores of DEG between NFIA-ETO2–expressing MEL and CTRL cells grown for 2 days in 2% DMSO (padj < 0.05). (D) PCA of the gene expression signatures of FL-derived EBs expressing NFIA-ETO2 or NFIA-ETO2ΔNHR4 grown in MM or for 24 hours in DM. Each point represents 1 sample, colored and shaped based on NFIA-ETO2 (red), or NFIA-ETO2ΔNHR4 (olive) expression based on the medium in which cells were cultured in (MM, dots; DM, triangles). (E) Volcano plot showing DEGs from the NFIA-ETO2- vs NFIA-ETO2ΔNHR4–expressing, FL-derived EBs after 24 hours in DM (FDR <0.05; logFC >±1.5 black lines). Orange and red points represent statistically significant dysregulated genes (FDR <0.05; logFC >±1.25; or FDR <0.01; logFC >±1.5 respectively), whereas purple points represent nonsignificantly regulated genes. (F) Selected positive and negative GSEA enrichment scores of DEGs between NFIA-ETO2- or NFIA-ETO2ΔNHR4–expressing, FL-derived EBs grown 24 hours in DM (P < .05). (G) GSEA shows significant enrichment for previously proposed24 direct ETO2 targets among upregulated DEGs in NFIA-ETO2–expressing FL-derived EBs) compared with NFIA-ETO2ΔNHR4–expressing cells grown for 24 hours in DM (P < .05). (H) Volcano plot showing DEGs from the NFIA-ETO2 vs NFIA-ETO2ΔNHR4-expressing EBs grown in MM vs NFIA-ETO2 vs NFIA-ETO2ΔNHR4–expressing, FL-derived EBs grown in DM for 24 hours (FDR >0.05; logFC >±1.5 black lines). Orange and red points represent statistically significant dysregulated genes (FDR <0.05; logFC >±1.25; or FDR <0.01; logFC >±1.5 respectively), whereas purple points represent nonsignificantly regulated genes. (I) Selected GSEA correlations of DEG from NFIA-ETO2 vs NFIA-ETO2ΔNHR4–expressing, FL-derived EBs grown in MM vs NFIA-ETO2 vs NFIA-ETO2ΔNHR4–expressing EBs grown in DM for 24 hours.

