Figure 5.
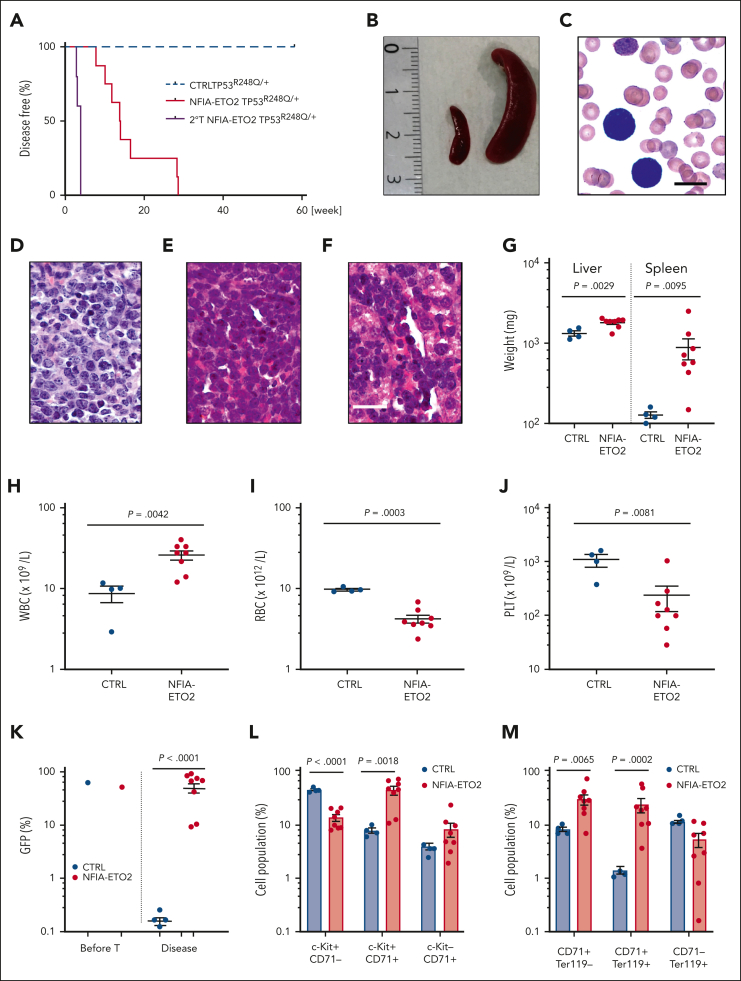
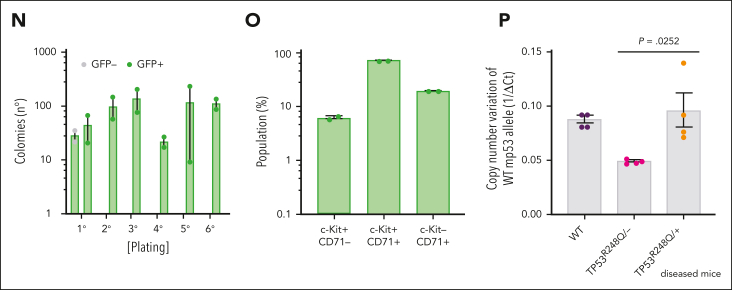
NFIA-ETO2–expressing TP53R248Q/+ hematopoietic cells induce erythroleukemia in mice. (A) Kaplan Meier plot of disease-free mice recipients of NFIA-ETO2–expressing (red line = primary recipients, n = 9; purple line = secondary recipients, n = 8) or CTRL TP53R248Q/+ cells (blue dashed line n = 4). (B) Spleens of a control (left) and a symptomatic mouse (right) that received transplantation with NFIA-ETO2–expressing TP53R248Q/+ cells (right). (C) Wright-Giemsa–stained peripheral blood smear from a diseased mouse showing 2 EBs (original magnification ×100; scale bar, 10 μm). (D-F) Images of H&E-stained sections of BM (D), spleen (E), and liver (F) of diseased mice that received transplantation with NFIA-ETO2–expressing TP53R248Q/+ EBs (original magnification ×40; scale bar, 30 μm). (G) Spleen and liver weight of symptomatic mice that received transplantation with NFIA-ETO2–expressing (red dots; n = 8) or CTRL cells (blue dots; n = 4). (H-J) Peripheral WBC (×109/L) (H), RBC counts (×1012/L) (I), and PLT counts (×109/L) (J) in symptomatic mice that received transplantation with NFIA-ETO2–expressing TP53R248Q/+ (red dots, n = 8) compared with mice that received transplantation with CTRL cells (blue dots; n = 4). (K) Fraction of transduced GFP+ cells (%) before transplantation (T) and at termination of the experiment in mice that received transplantation with NFIA-ETO2- (red dots; n = 8) or CTRL (blue dots; n = 4) EBs. (L) Kit and CD71 surface expression in total BM cells (in percentage) from symptomatic mice that received transplantation with NFIA-ETO2–expressing TP53R248Q/+ cells (n = 8) or vector-transduced control (CTRL) cells (n = 4). (M) CD71 and Ter119 surface expression in total BM cells (in %) from symptomatic mice that received transplantation with NFIA-ETO2–expressing TP53R248Q/+ cells (n = 8) or CTRL cells (n = 4). (N) Colony formation by GFP+ and GFP− EBs harvested from symptomatic mice that received transplantation with NFIA-ETO2–expressing TP53R248Q/+ cells. Shown are absolute numbers of colonies from first to the sixth consecutive plating in MC. (O) Kit and CD71 surface expression in cells (in %) from the second MC plating of GFP+ cells from symptomatic mice that received transplantation with NFIA-ETO2–expressing TP53R248Q/+ cells. (P) Quantification of Tp53 alleles in BM cells from WT (purple dots), TP53R248Q/− (pink dots), and from symptomatic mice that received transplantation with NFIA-ETO2–expressing TP53R248Q/+ cells (orange dots) assessed via PCR analysis. Values are presented as individual points; bar graphs represent the mean value of independent biological replicates (n); and error bars are standard error of the mean. Statistical significance was tested with unpaired two-tailed t tests. H&E, hematoxylin and eosin.


