Figure 5.
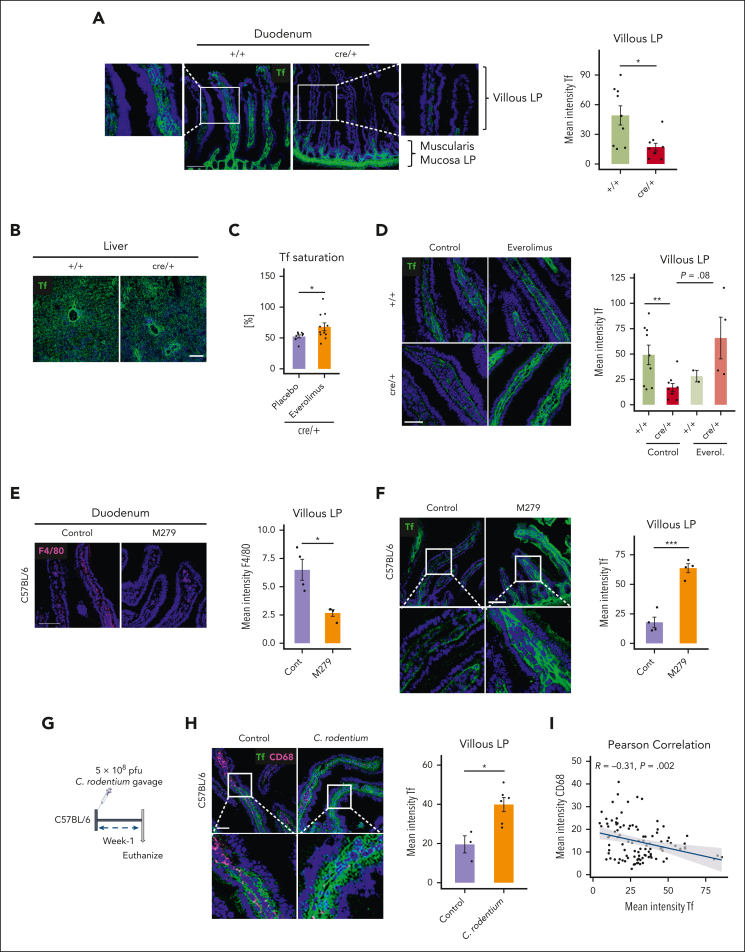
Villous LP macrophages control local transferrin levels in the duodenum. (A) Representative image of immunofluorescent staining for Tf on mouse duodenum cryosections obtained from control (+/+) and cre/+ mice showing villous LP and muscularis mucosa LP regions. Scale bar, 100 μm. Quantification of Tf mean fluorescence intensity in duodenal LP (∗P < .05). (B) Representative image of immunofluorescent staining for Tf on liver cryosections of control (+/+) and cre/+ mice. Scale bar, 100 μm. (C) Tf saturation was determined in the serum of cre/+ mice treated with everolimus (inhibitor mTORC1 signal) compared with control cre/+ mice treated with 1× PBS (∗P < .05). (D) Representative image of immunofluorescent staining for Tf on mouse duodenum cryosections of +/+ and cre/+ mice treated with everolimus. Scale bar, 50 μm. Quantification of Tf fluorescence intensity in the duodenum LP. (E-F) Representative image of immunofluorescent staining for F4/80 (macrophage marker) and quantification of its mean fluorescence intensity (∗P < .05), (E) and for Tf (F) and quantification (∗∗∗P < .001) on mouse duodenum cryosections obtained from C57BL/6J mice treated with CSFR1 receptor inhibitor (M279) to deplete LP macrophages. Scale bar, 100 μm. (G) Graphical depiction of C rodentium treatment of 9- to 12-week-old C57BL/6J mice. One week after oral C rodentium inoculation, tissues were collected and analyzed. (H) Representative image of immunofluorescent staining for Tf and CD68 (macrophage marker) on mouse duodenum cryosections obtained from C57BL/6J mice treated with 1× PBS, and C57BL/6J mice treated with C rodentium. Scale bar, 50 μm. Quantification of Tf mean fluorescence intensity in LP (∗P < .05). (I) Pearson correlation between Tf and CD68 mean fluorescence intensity per villi in C57BL/6J mice treated with C rodentium.

