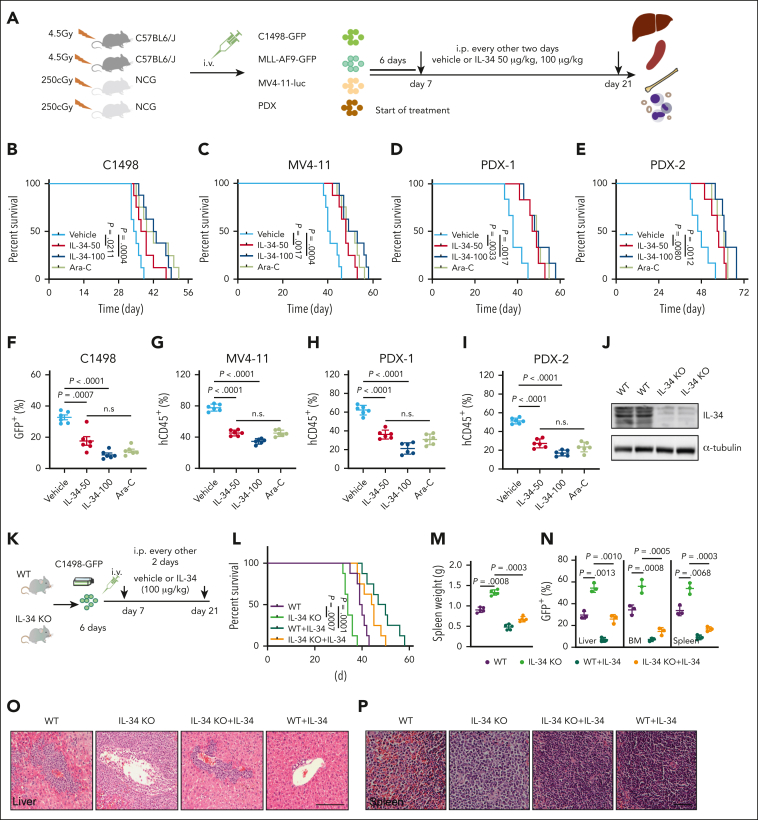
Figure 1.
IL-34 suppressed AML progression and improved survival in vivo. (A) Experimental strategy of C1498-GFP, MLL-AF9-GFP, and MV4-11–luciferase and mice with PDXs. (B-E) Kaplan-Meier survival curves of mice with C1498-GFP xenotransplants (B; n = 8), mice with MV4-11 xenotransplants (C; n = 8), and mice with PDXs (D-E; n = 6) after treatment with vehicle, IL-34 (50 or 100 μg/kg), or Ara-C. P values determined using log-rank test. (F) Fluorescence-activated cell sorting analysis of the percentage of GFP+ AML cells in the BM of mice with C1498-GFP xenotransplants at day 28 (n = 6). (G) NCG mice received implantation with luciferase-expressing MV4-11 cells and were treated with IL-34 as indicated (n = 6). Flow cytometry analysis of the percentage of human CD45 cells obtained from the BM of mice with leukemia. (H) Percentage of human CD45+ cells in the BM of NCG mice with xenografts derived from patients with AML (PDX-1) and that were treated with the indicated doses of IL-34 or Ara-C (n = 6). (I) Percentage of human CD45+ cells in the BM of NCG mice that received transplantation with xenografts derived from patients with AML (PDX-2) and were treated with the indicated doses of IL-34 or Ara-C (n = 6). (J) Representative western blots of spleen samples from WT or IL-34 KO mice. (K) In vivo AML model in IL-34 KO and WT mice treated with vehicle or IL-34. (L) Kaplan-Meier survival analysis of IL-34 KO or WT mice with leukemia with or without treatment with IL-34. Statistical analysis using the log-rank (Mantel-Cox) test (n = 6). (M) Spleen weights of mice in panel K (n = 5). (N) Fluorescence-activated cell sorting analysis of the percentage of GFP+ AML cells in the liver, BM, and spleen from mice in panel K at day 28 (n = 3). (O-P) Hematoxylin and eosin–stained liver (O) and spleen (P) from mice in panel K. Scale bars, 100 μm. Statistical significance was calculated using one-way analysis of variance (ANOVA) with Tukey multiple comparison test. Data are representative of at least 3 independent experiments, with cohorts of the indicated number of mice per group.

