Figure 2.
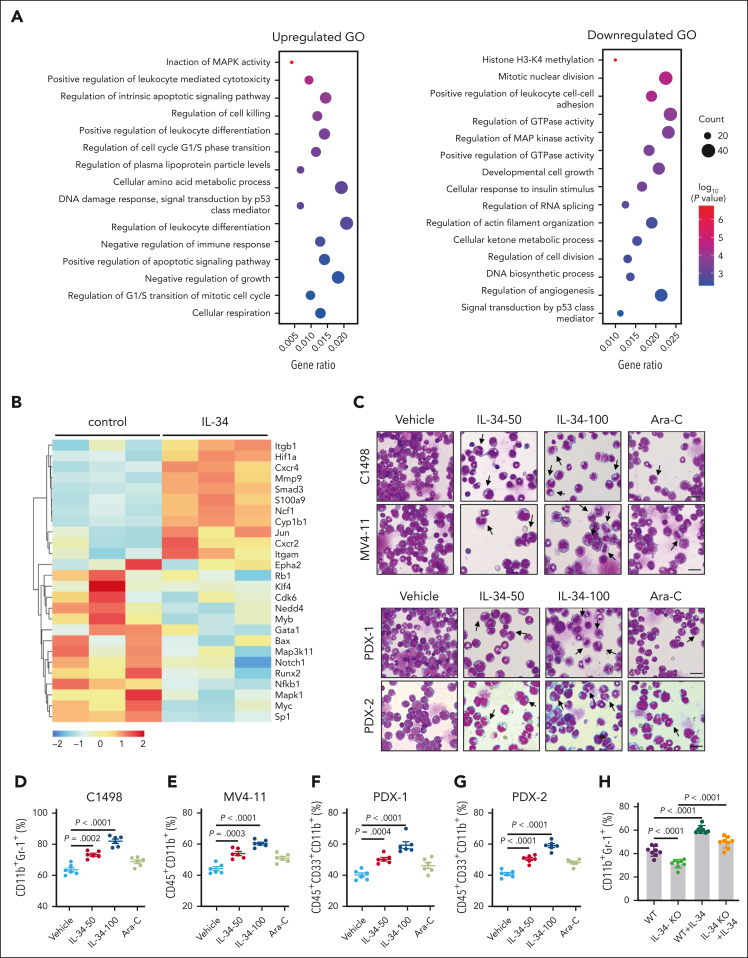
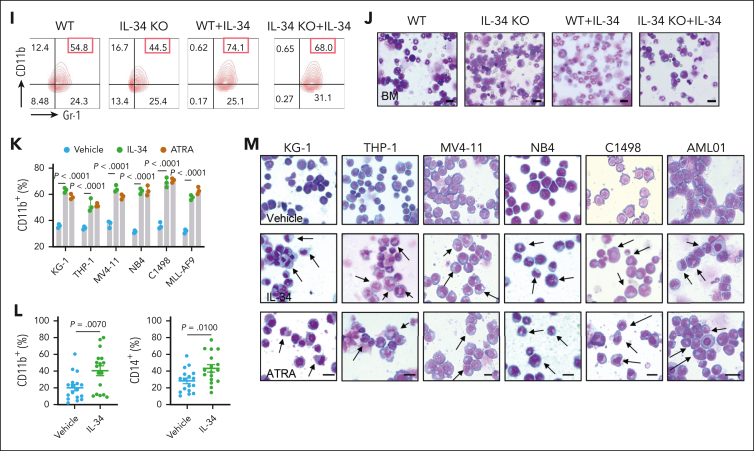
IL-34 triggered leukemic cell differentiation in vitro and in vivo. (A) Gene ontology enrichment analyses of upregulated and downregulated pathways after IL-34 treatment (100 ng/mL). (B) Heat map of top 30 differentially expressed genes after IL-34 treatment in C1498 cells. (C) Representative Wright-Giemsa–stained cytospins of BM cells from mice treated with IL-34 showing signs of granulocytic differentiation. Scale bars, 20 μm. (D-G) Flow cytometry analysis of mature myeloid cells in the BM of mice treated with vehicle, IL-34, or Ara-C (n = 6). Populations are gated on GFP+ cells (D) and CD45+CD33+ cells (E-G). (H-I) Flow cytometry analysis of CD11b+Gr-1+ population gated on GFP in the BM of IL-34 KO and WT mice with leukemia, treated with or without IL-34 (100 μg/kg; n = 8). (J) Wright-Giemsa–stained BM of mice from panel I. Scale bars, 20 μm. (K) Flow cytometry analysis of myeloid differentiation marker CD11b in different AML cell lines treated with IL-34 (100 ng/mL) or all-transretinoic acid (ATRA) (500 nM). (L) Flow cytometry analysis of CD11b and CD14 expression on viable myeloid (CD33+) cells from 17 primary AML samples before and after incubation with recombinant human IL-34 (rhIL-34). (M) Wright-Giemsa staining of AML cell lines and primary AML cells. Scale bars, 10 μm. Data are representative of at least 3 independent experiments with cohorts of the indicated number of mice per group. Statistical significance was calculated using one-way ANOVA with Tukey multiple comparison test.


