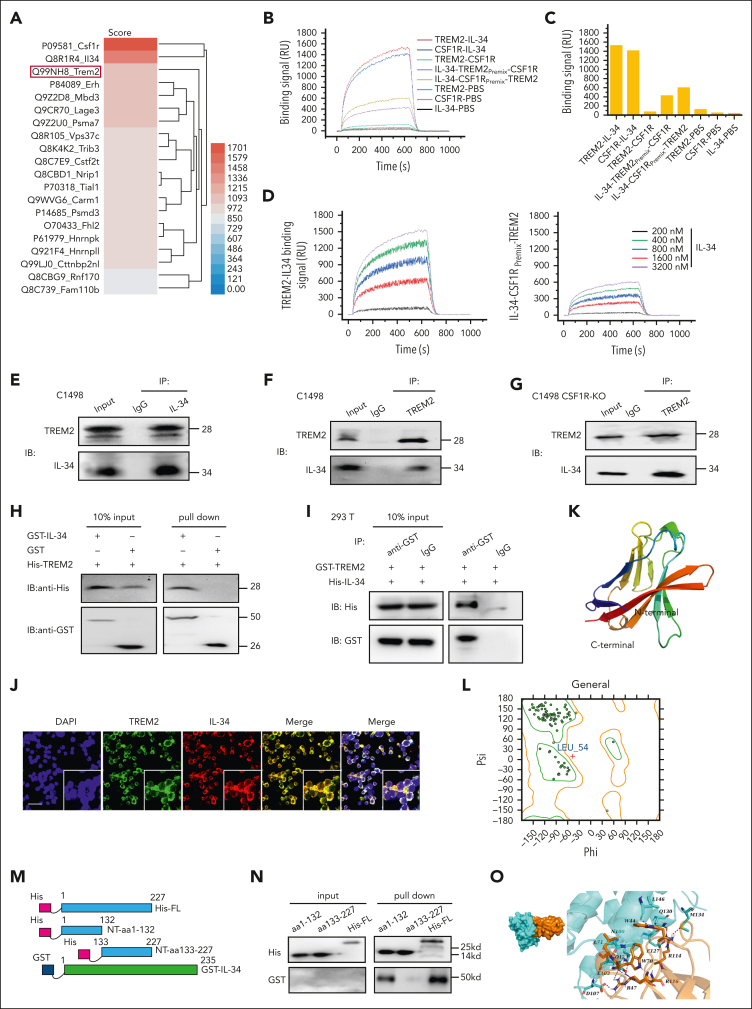
Figure 4.
IL-34 induced leukemia cell differentiation independent of known receptors CSF1R, PTPRZ1, and SDC1, but bound directly to TREM2. (A) Heat map of IL-34 target proteins in C1498 cells. (B) Binding response curves of IL-34–TREM2, IL-34–CSF1R, and TREM2–CSF1R, validated by SPR analysis. (C) Binding affinity described in panel B. (D) (Left) SPR imaging (SPRi) assay involving TREM2 and IL-34. (Right) SPRi assay detecting TREM2 and IL-34 premixed with CFS1R. (E-F) Coimmunoprecipitation assay of endogenous TREM2 and IL-34 in C1498 cells. (G) Coimmunoprecipitation assay of endogenous TREM2 and IL-34 in CSF1R KO cells. (H) Direct binding of GST–IL-34 to His-TREM2 using GST pulldown assay. (I) Coimmunoprecipitation assay of exogenous GST-tagged TREM2 and His-tagged IL-34. (J) Representative immunofluorescence images revealing co-localization of exogenous IL-34 (red) and TREM2 (green) in C1498 cells. Scale bar, 100 μm. (K) The homology model of TREM2. (L) Ramachandran plot for TREM2. Dark green dots represent residues in favored regions; yellow dots represent residues in allowed regions; red cross represents residues in irrational regions. (M) Schematic diagram of TREM2 constructs: His-tagged NT-aa1-132, His-tagged NT-aa133 to 227, and full-length TREM2 His-FL-aa1-227. (N) GST pulldown assay examining interactions between GST-fused IL-34 and various His-TREM2 protein fragments. (O) Molecular docking model of interaction between IL-34 and TREM2. (Left) surface binding model of IL-34 with TREM2. (Right) detailed interaction between IL-34 and TREM2. IL-34, colored cyan; TREM2, colored orange; residues in IL-34, colored cyan; residues in TREM2, colored orange; red dashes represent hydrogen bond interactions; and blue dashes represent salt bridges.

