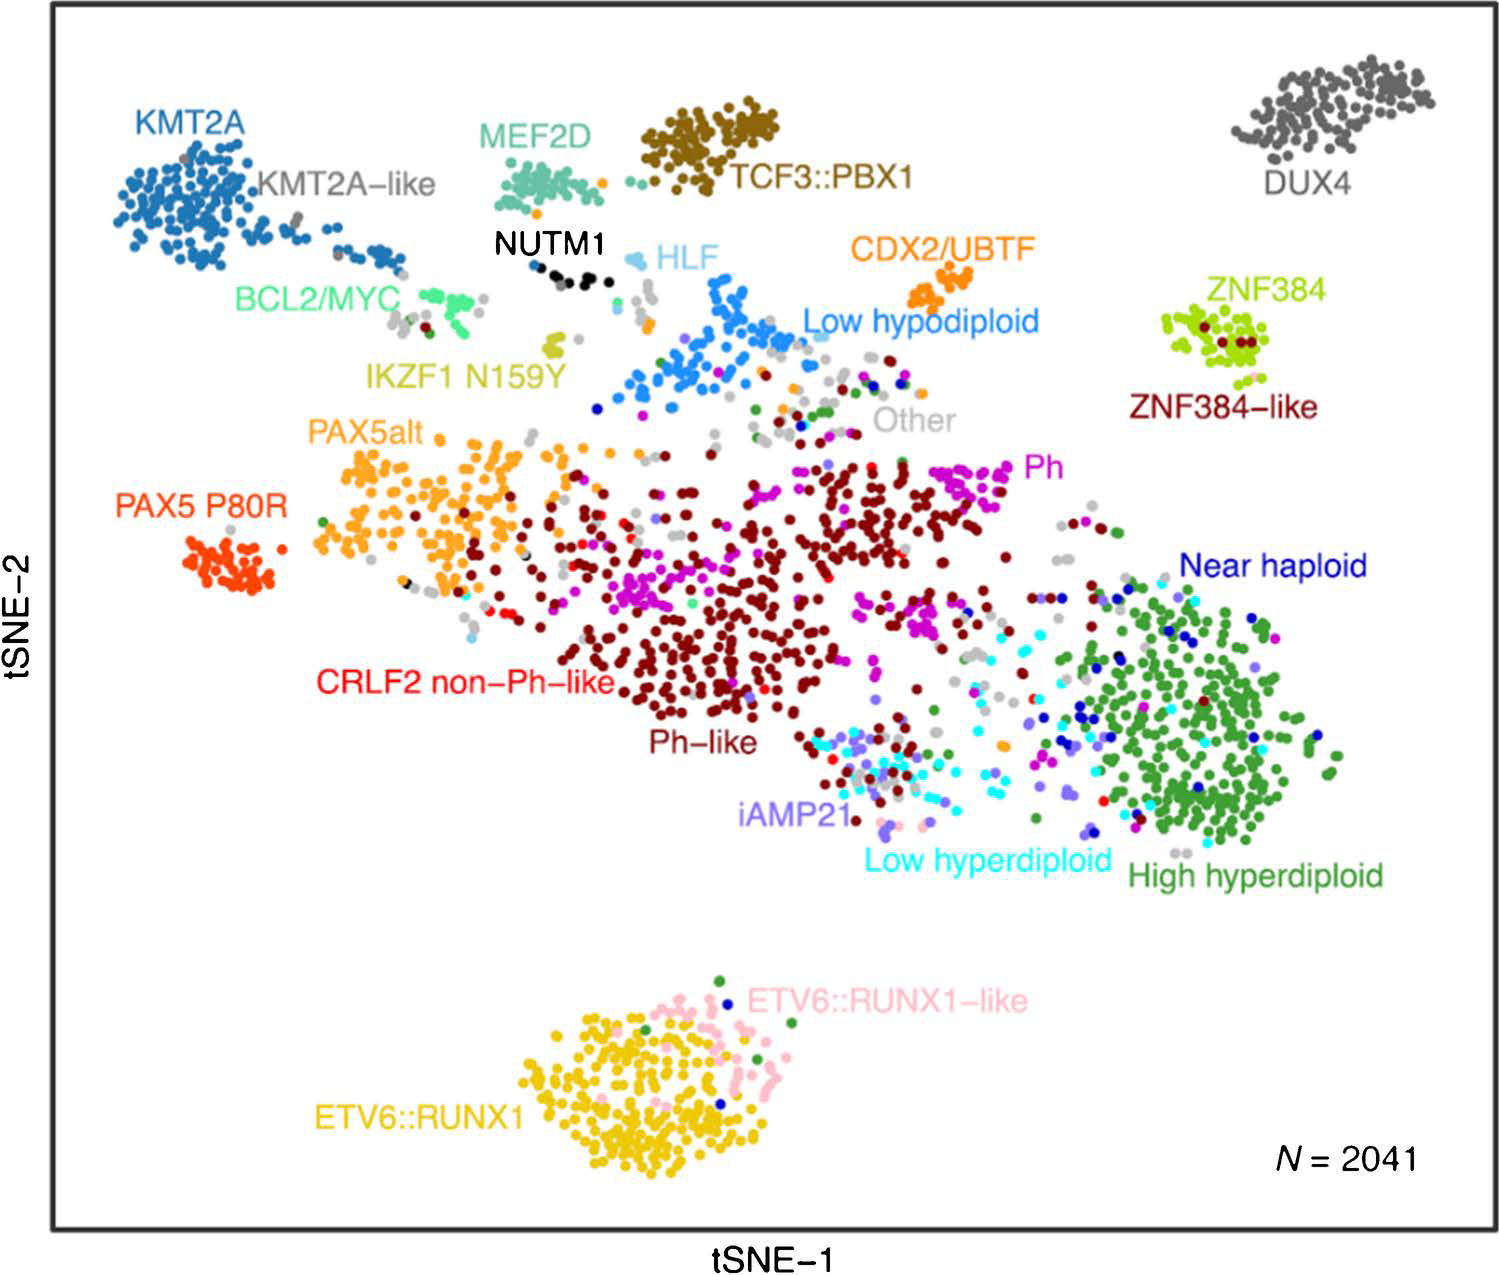
Figure 1. Gene expression clustering of B-ALL cases.

The figure depicts two dimensional clustering using t-distributed stochastic neighbor embedding of whole transcriptome sequencing data from 2041 leukemia samples collected at diagnosis from children or adults with ALL. Cases are color coded by subtype. This approach, and much of the data, were first reported by Gu, et al. [18], and has been updated to include additional CDX2/UBTF cases following recent definition of this subtype.
