. 2023 Oct 25;14(44):12484–12497. doi: 10.1039/d3sc02782a

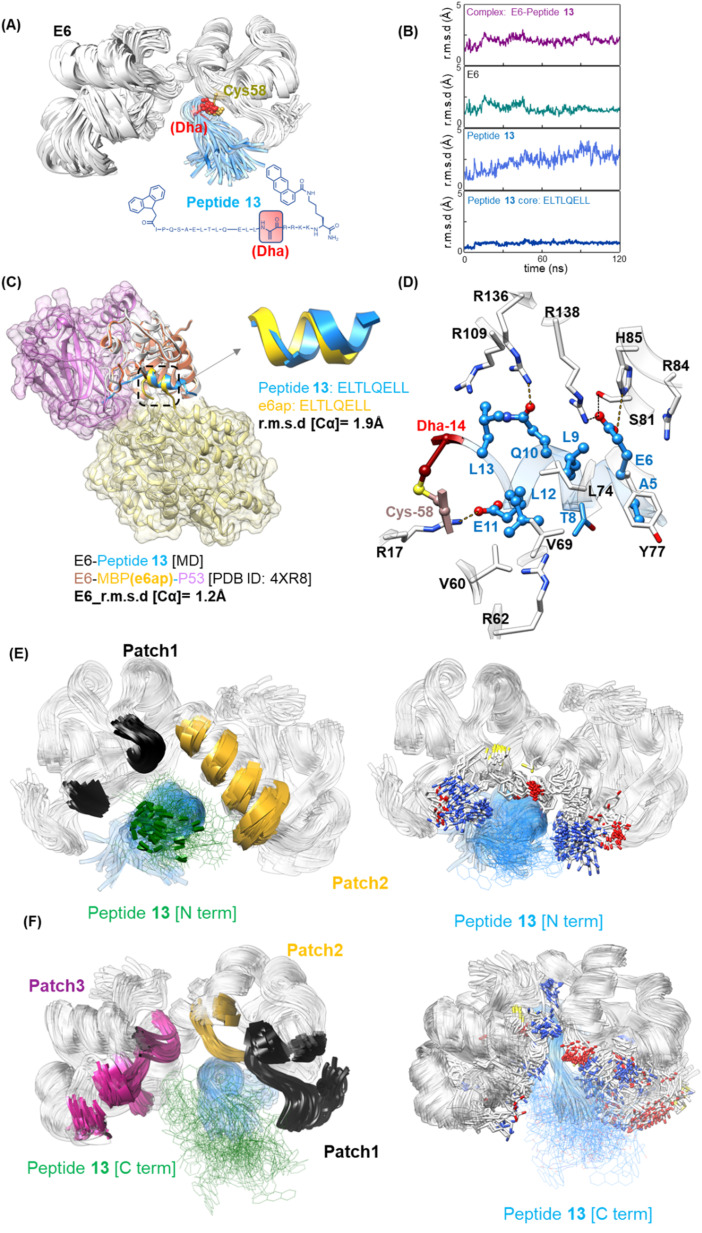
Fig. 5. Molecular modeling of the E6–peptide 13 conjugate. (A) Structural representation of 16E6 (white) bound to 13 (blue) featuring the Dha warhead (red), obtained through ∼120 ns MD simulation. The structure represents the averaged configurations of 13 within calculated clusters (see methods). (B) Trajectory analysis of root mean squared differences (r.m.s.d.) during MD simulations, showing stability and modest conformational changes of the complex. (C) Comparison of molecular modeling of the 13 : 16E6 complex with the X-ray structure of 16E6 (coral)–E6AP LXXLL peptide (yellow), p53 (plum) complex (PDB ID 4XR8). All r.m.s.d. were calculated for the Cα atoms. All structures were compared to the initial structure. (D) Intermolecular interactions between 16E6 (white) and 13 (blue), identified and analyzed from the MD simulation. Interactions shown in (D) are persistent during the ∼120 ns MD simulation. Dotted yellow lines represent hydrogen bonding. (E) Covered surfaces by the N-terminus within 5 Å: patch 1 in black [V38, Y39, C40, K41, R62, E63], patch 2 in yellow [C73, F76, Y77, I80, Y83, R84, H85, R136]. Left: E6 and 13 N-term detailed interactions. (F) Covered surfaces by the C-terminus within 5 Å: patch 1 [M8, F9, Q10, D11, P12, Q13, E14, R15, P16, R17, K18, L19, P20, Q21, D25]. Patch 2 in yellow [A53, D56, R55, L57, C58*]. Patch 3 in purple [Y99, K101, D105, L107, I108, R109, C110, C113, Q114, K115, P116, L117, R136, R138, W139, T140]. Left: E6 and C-terminal 13 detailed interactions.

Fig. 5