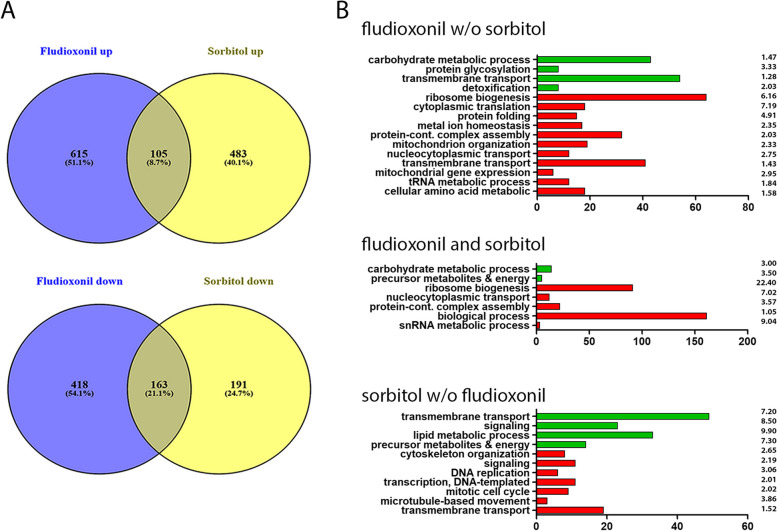
Fig. 3.
Comparison of the transcriptional responses of the A. fumigatus wild type to fludioxonil and hyperosmotic stress. The fludioxonil data were obtained after 1 h exposure of the wild type. The data on the hyperosmotic stress response were obtained from Pereira Silva et al. (2016) 10 min after exposure to 1 M sorbitol. A threshold value of 1.5 log2FC was applied to both data sets. A shows Venn diagrams of the up- und down-regulated genes in both responses. The enriched GO terms of the differentially regulated genes are summarized in B. The number of genes of the respective categories and the fold-enrichment values are indicated

