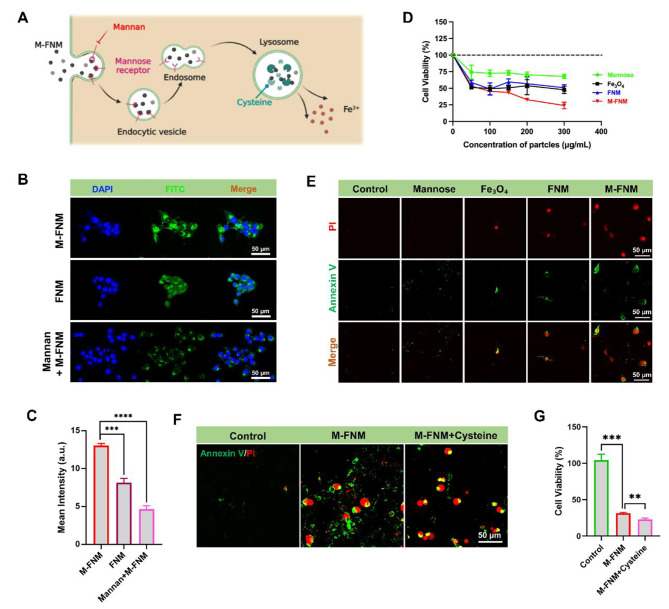
Fig. 2.
Cell uptake behavior and targeting effects of M-FNM. (A) Schematic illustration of cell uptake behavior and degradation process of M-FNM. (B) CLSM images of FNM/M-FNM (100 µg/mL) or with/without mannan labeled with FITC toward CAL27 cells. (C) Corresponding semi-quantitative analysis of FITC. (D) Relative cell viabilities of CAL27 cells after various treatments (300 µg/mL). (E) CLSM images of Annexin V/PI co-stained CAL27 cells after different treatments. (F) CLSM images of Annexin V/PI toward CAL27 cells with/without cysteine (10 µM). (G) Cytotoxicity of M-FNM toward CAL27 cells with/without cysteine (10 µM). (Mannan: 80 µg/mL; M-FNM: 300 µg/mL). Compared to control, *P < 0.05, **P < 0.01, ***P < 0.001, and ****P < 0.001. The mean values and standard deviations represent the average of biological triplicates

