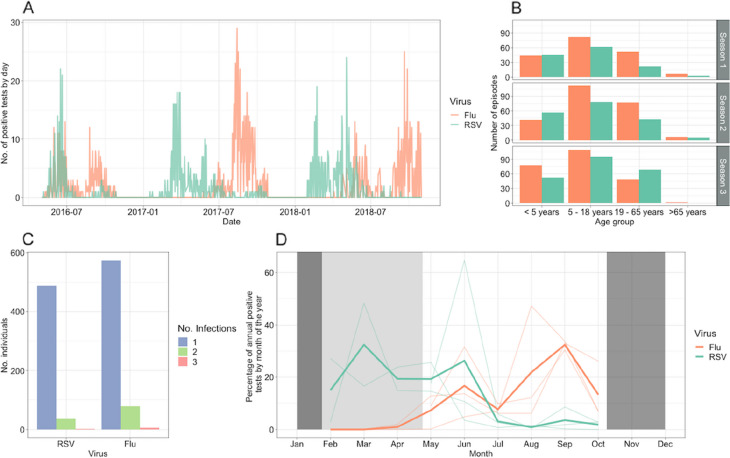
Fig. 1.
A All positive test results over time for influenza (Flu) and respiratory syncytial virus (RSV). B Number of infection episodes in each age group, across the three seasons. C Number of individuals against the number of infections for each virus, where positive tests within 14 days are assumed to be due to the same infection. D Seasonality of influenza and RSV infections, depicting the percentage of annual positive tests by month of the year. The semi-transparent lines depict the individual seasons. The solid lines depict the mean across seasons. Dark-shaded areas depict months where no samples were taken, and the light-shaded area shows samples not taken in the 2016 season

