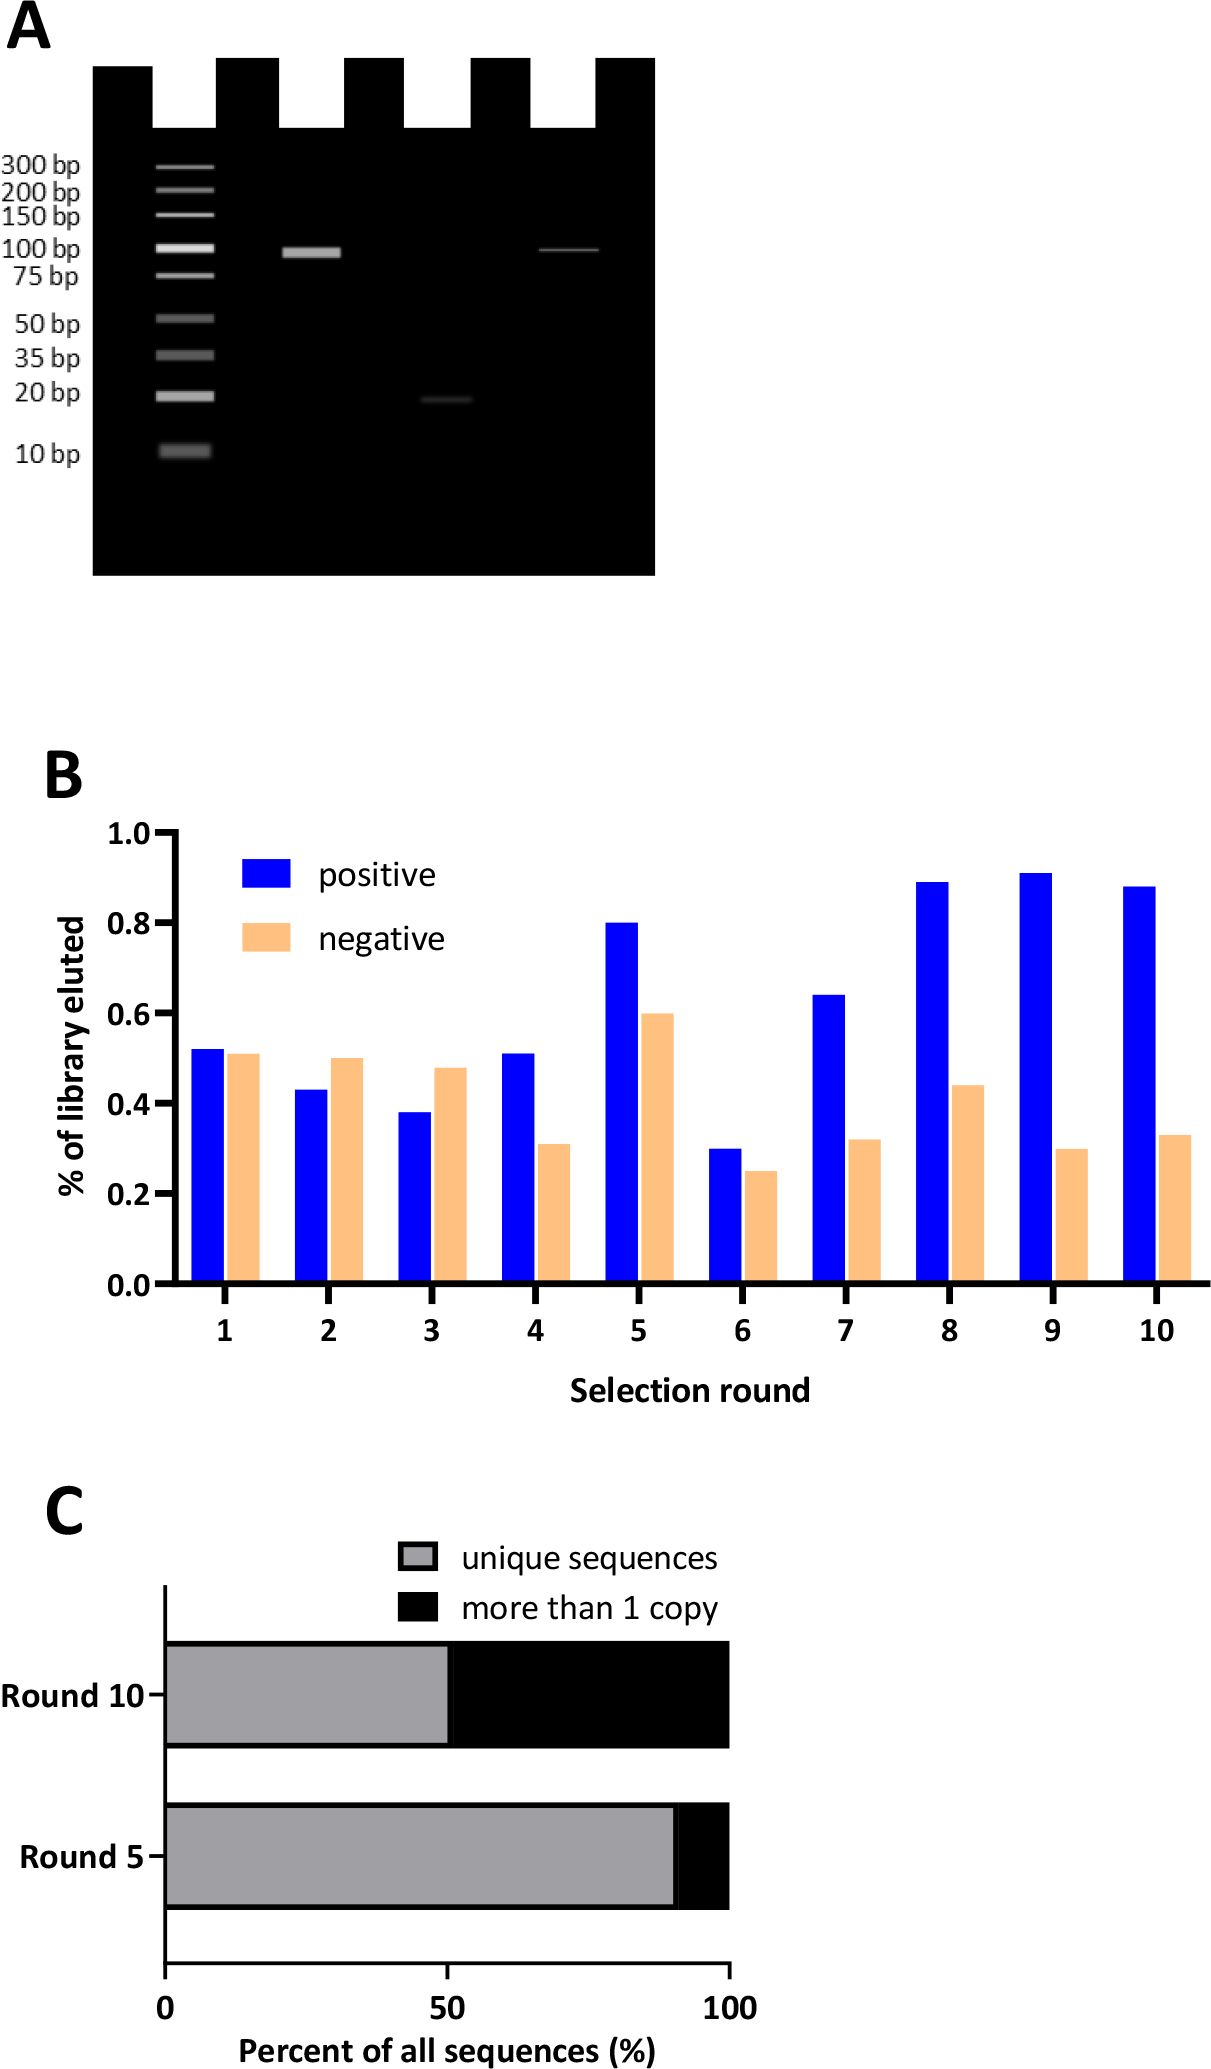
Figure 3. Representative analysis of the in vitro selection process.

A. Ideal Polymerase Chain Reaction (PCR) amplification analyzed by gel electrophoresis. Lane 1 ladder, lane 2 positive control, lane 3 negative control, lane 4 amplification of the library following a round of selection. B. One method for monitoring the in vitro selection process is by comparing the quantity of library that interacts with the target compared to controls. Blue bars represent percent of library from each positive selection round (the target of interest); orange bars represent the library recovered from a parallel negative control selection round (absence of target). C. Landscape of sequence enrichment throughout rounds ofin vitro selection. In early rounds, the library is not enriched and therefore sequencing yields a diverse sequence pool with very few copies of the same sequence and are therefore mostly unique sequences. In later rounds, after enrichment has occurred, more sequences will emerge from the data that have numerous copies, thus resulting in fewer unique sequences.
