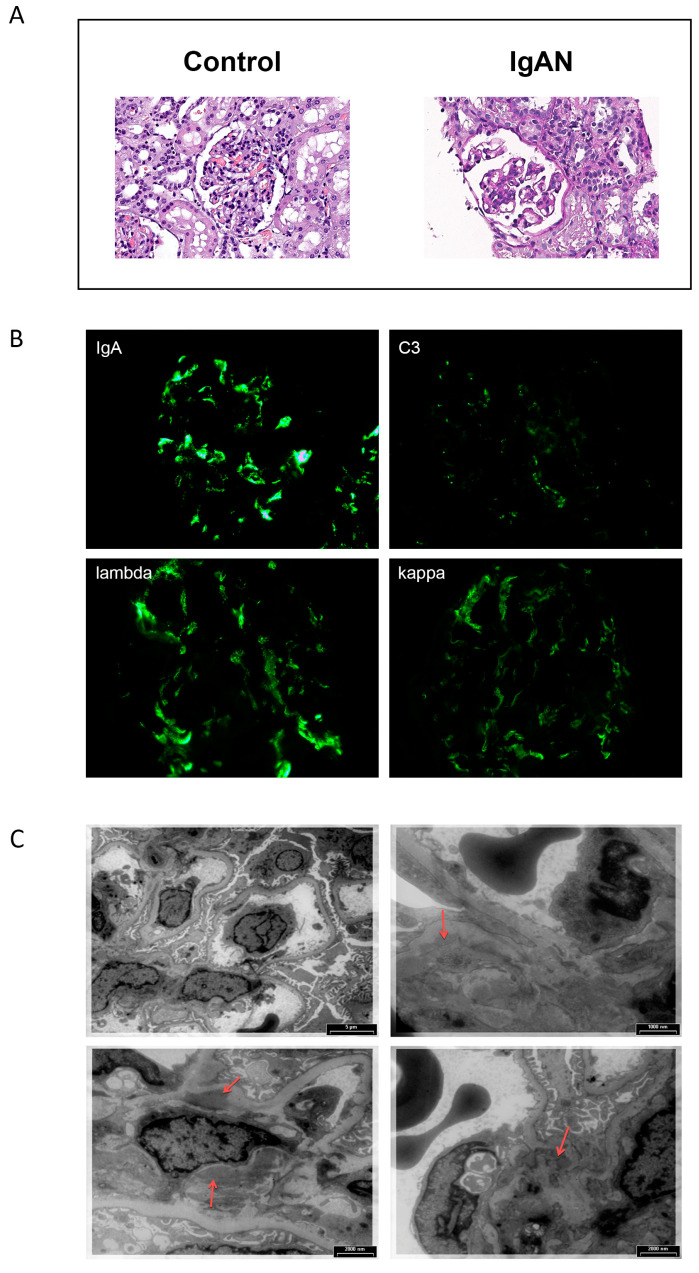
Figure 1.
Renal biopsy of a typical patient with IgA nephropathy (M1E0S1T0-C0, according [38]). Hematoxylin-eosin stain (magnification ×400), compared with control sample (A). Immunofluorescence microscopy, with staining for IgA, C3, lambda, and kappa (magnification ×400) (B). Electron microscopy. Red arrows indicate paramesangial deposits (C).

