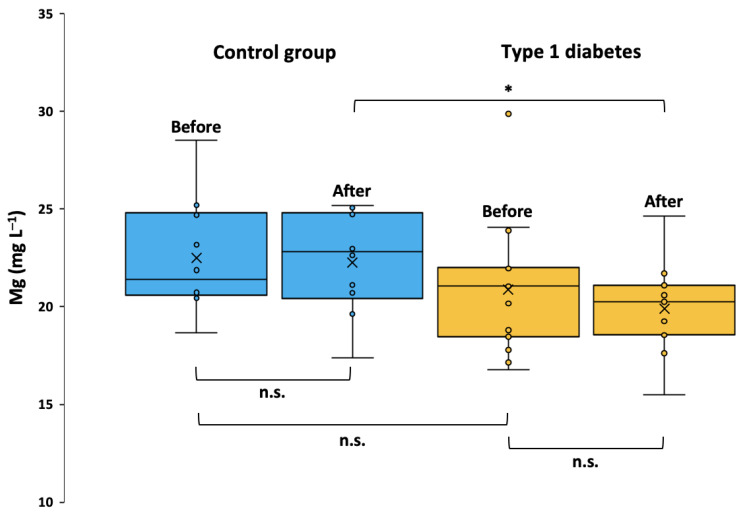
Figure 2.
Magnesium concentrations determined in blood serum samples drawn from control group and T1DM individuals before and one hour after insulin injection and/or consuming the standard meal. The box represents the 25–75th percentiles (with the median as a horizontal line, mean as a cross) and the whiskers represent the range. Outliers are denoted outside of the range if they exceed a distance of 1.5 times the interquartile range below the first quartile or above the third quartile. The threshold for significance was defined as p < 0.05 (*), n.s. means not significant. All other relationships displayed no statistical significance (p ≥ 0.05).

