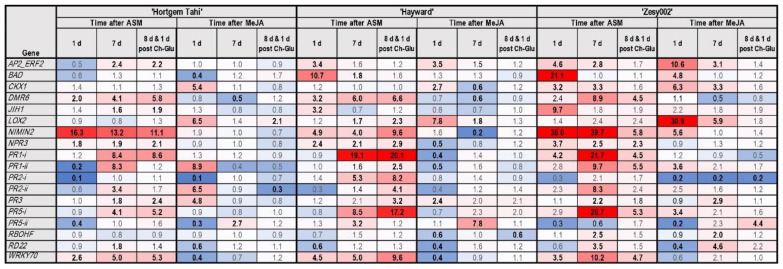
Figure 9.
Heat map presenting fold-change in gene expression data in Actinidia arguta ‘Hortgem Tahi’, A. chinensis var. chinensis ‘Zesy002′ and Actinidia chinensis var. deliciosa ‘Hayward’ kiwifruit plants sprayed with 0.2 g/L Actigard® (ASM), or 2.25 mmol/L methyl jasmonate (MeJA) plus 0.05% v/v Du-Wett® (DW) surfactant or 0.05% v/v DW only (control), 7 days before treatment with Ch-Glu (0.125 g/L each of chitosan and laminarin). Gene expression was measured at 1 and 7 days post-inducer application, and 1 d post-Ch-Glu application (i.e., 8 days post-inducer application). Gene counts were measured by NanoString PlexSet® with normalization against the reference genes 40s, Actin2, GAPDH and PP2A. Fold-change data in red shades indicate an upregulation relative to the control, whilst blue shades represent downregulation relative to the control, with increasing colour intensity indicating larger fold-changes. Statistically significant differences from the control at individual time points, as determined by LSD (p ≤ 0.05), are identified in bold typeface.

