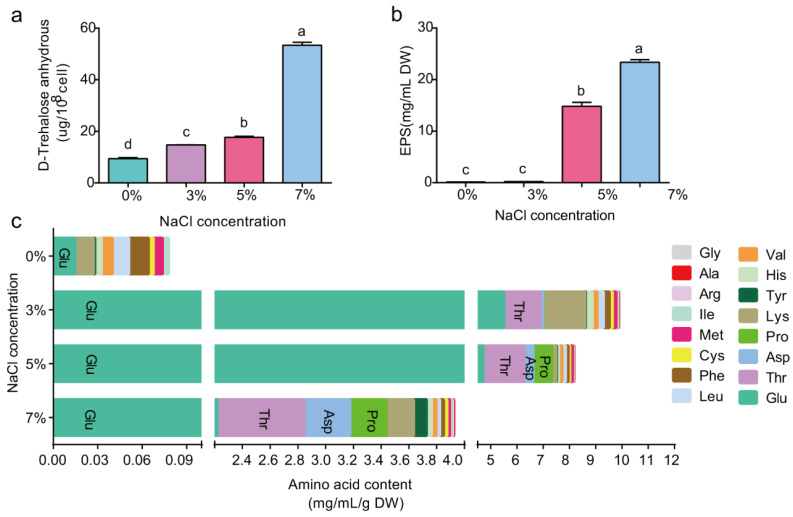
Figure 2.
The intracellular D-trehalose (a), aa (b) and EPS (c) in P. megaterium ZS-3 were quantified at different salt concentrations (0%, 3%, 5%, and 7% NaCl). Values represent the means of three biological experiments, each in three technical replicates. Error bars represent SE. Different lowercase letters above the bars represent significant differences based on one-way ANOVA (p < 0.05).

