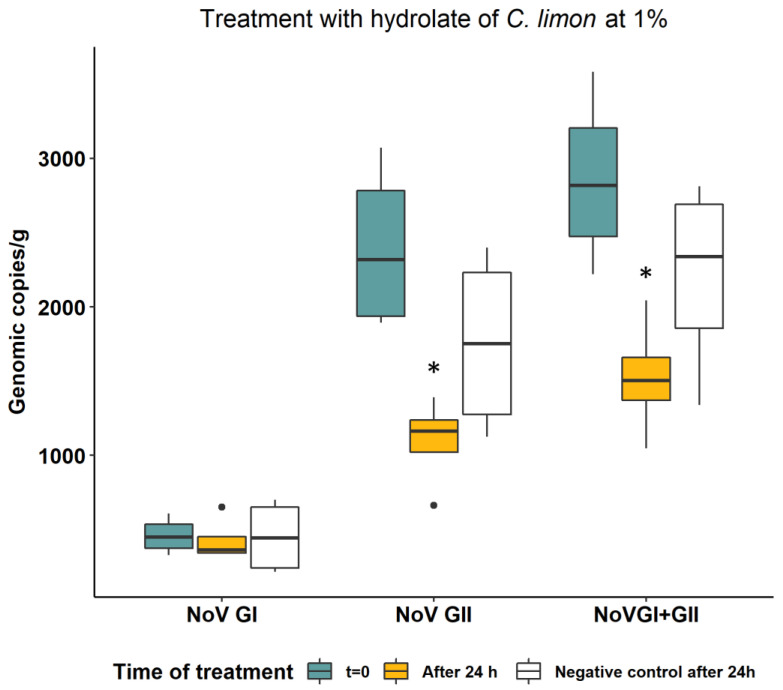
Figure 2.
NoV RNA concentration in oysters before and after treatment of 24 h with hydrolate of C. limon at 1%. Values are expressed in genomic copies/gram. Boxplots indicated with asterisks were statistically significantly different with respect to t = 0 and negative controls (Wilcoxon signed rank test, p < 0.05).

