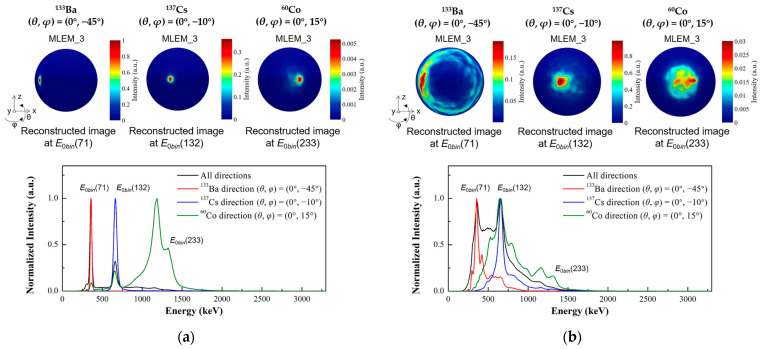
Figure 13.
Multiple source localization with the prototype under the following test conditions: a 133Ba source positioned at (θ, φ) = (0°, −45°), a 137Cs source positioned at (θ, φ) = (0°, −10°), and a 60Co source positioned at (θ, φ) = (0°, 15°). The reconstructed images at the corresponding energy slices and the reconstructed initial energy spectra after 3 iterations are shown. The vertical axis of the reconstructed energy spectra is represented by normalized intensity. (a) The simulation results. (b) The experimental results.

