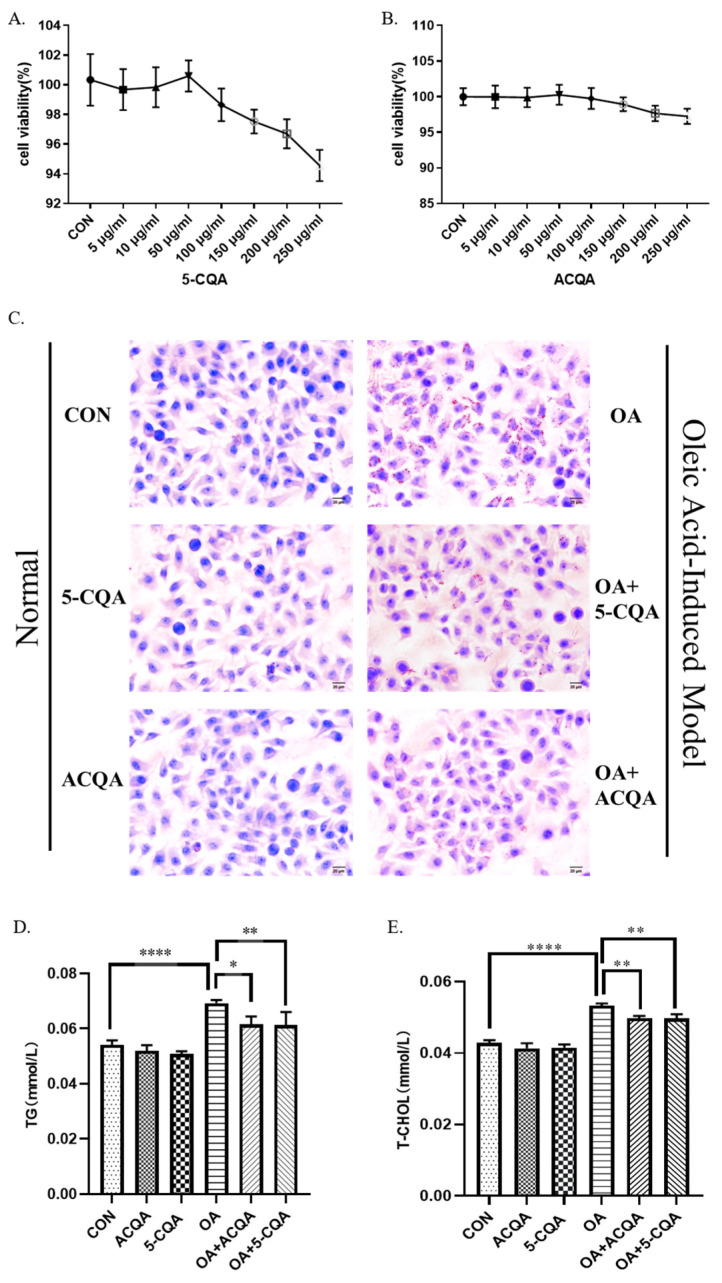
Figure 1.
ACQA ameliorated steatosis of HepG2 cells. (A,B) The cell viabilities of HepG2 subjected to different concentrations of 5-CQA and ACQA were detected and analyzed via CCK-8 assay. The concentration of 50 µg/mL was the optimal concentration for both 5-CQA and ACQA. (C) Oil red O staining was performed in HepG2 cells. Red fat drops indicate the accumulation of triglycerides. Images presented are in ×40 magnification. Scale bar: 40× microscope is 20 μm. The levels of TG (D) and T-CHOL (E) were detected using assay kit and analyzed with enzyme-labeled apparatus. Data are expressed as mean ± SD, * p < 0.05, ** p < 0.01 and **** p < 0.0001, and compared with OA group, n = 3.

