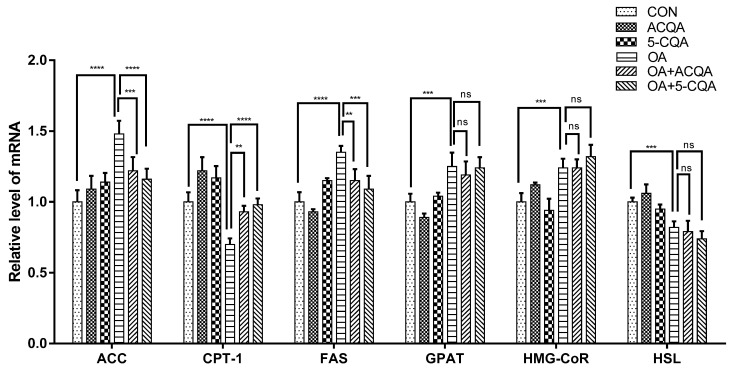
Figure 2.
The mRNA levels of lipid metabolism-related genes in HepG2 cells. mRNA of each group was extracted, and mRNA levels of ACC, CPT-1, FAS, GPAT, HMG-CoR and HSL were detected via quantitative RT-PCR. Data are expressed as mean ± SD, ns p > 0.05, ** p < 0.01, *** p < 0.001 and **** p < 0.0001, and compared with OA group, n = 3.

