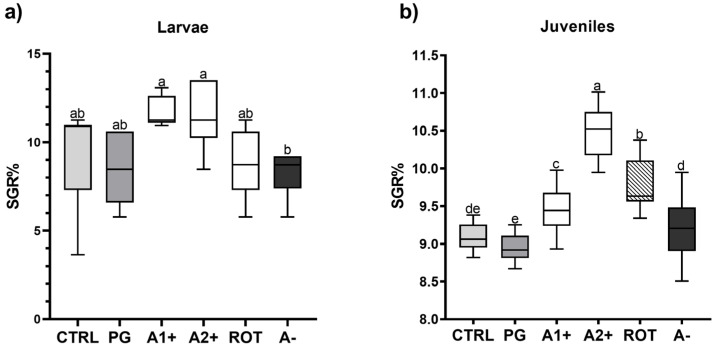
Figure 1.
Specific growth rate (% day −1) of zebrafish (a) larvae and (b) juveniles fed the experimental diets. Boxplots show minimum and maximum (whiskers), first quartile, median, and third quartile (box). a–e Different letters indicate statistically significant differences among the experimental groups (p < 0.05).

