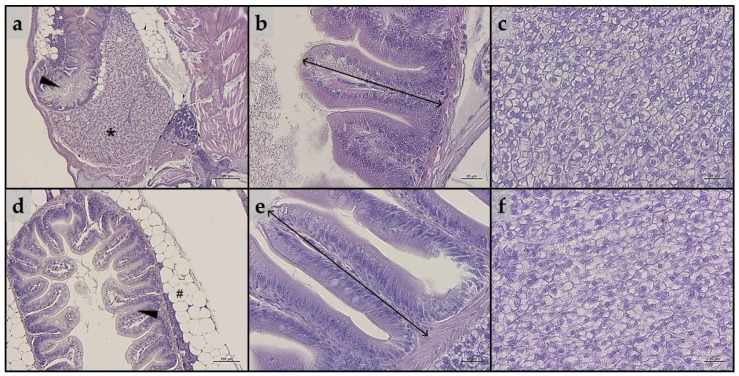
Figure 3.
Example of histomorphology of intestine and liver parenchyma of zebrafish (a–c) larvae and (d–f) juveniles from the present study. (a) Representative section of liver (*) and intestine (arrowhead) of a whole-embedded zebrafish larva fed CTRL diet; (b) details of mucosal folds of intestine from a zebrafish larva fed PG diet (double-headed arrow indicate mucosal folds height); (c) liver parenchyma from a zebrafish larva fed A1+ diet; (d) section of intestine (arrowhead) from a zebrafish juvenile fed A2+ diet (# indicate perivisceral adipose tissue); (e) details of mucosal folds of intestine from a zebrafish juvenile fed ROT diet (double-headed arrow indicate mucosal folds height); (f) liver parenchyma from a zebrafish juvenile fed A− diet. Scale bars: a = 200 μm; b,c,e,f = 20 μm; d = 100 μm.

