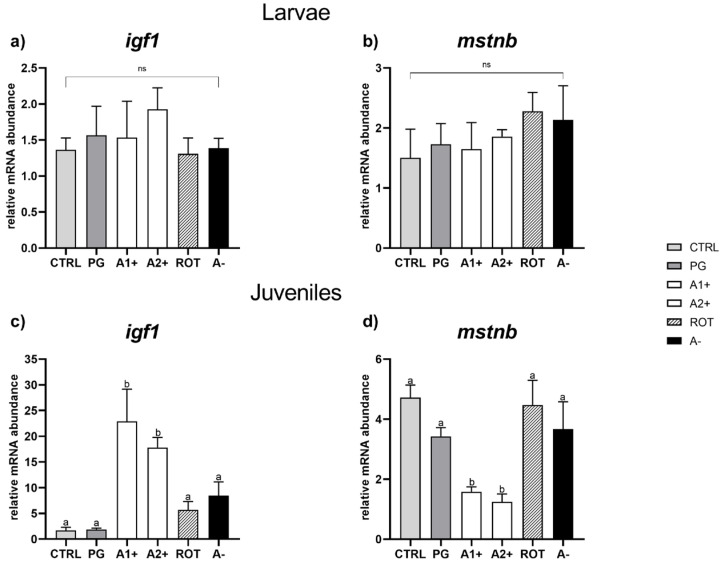
Figure 4.
Relative mRNA abundance of genes involved in growth analyzed in whole larvae or in liver samples from juveniles. (a) igf1 and (b) mstnb in larvae; (c) igf1 and (d) mstnb in juveniles. Results are expressed as mean + SD (n = 5). a,b Different letters denote statistically significant differences among the experimental groups; ns, no significant differences.

