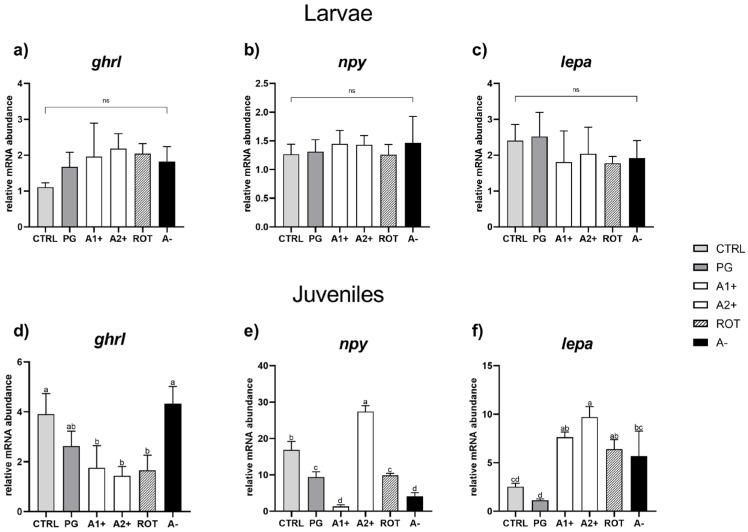
Figure 5.
Relative mRNA abundance of genes involved in appetite regulation analyzed in whole larvae or in intestine (ghrl), brain (npy), and liver (lepa) samples from juveniles. (a) ghrl, (b) npy, and (c) lepa in larvae; (d) ghrl, (e) npy, and (f) lepa in juveniles. Results are expressed as mean + SD (n = 5). a–d Different letters denote statistically significant differences among the experimental groups; ns, no significant differences.

