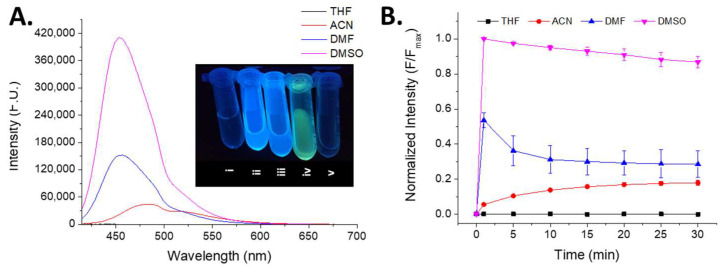
Figure 3.
Emission response of the iron (III) complex (C1) after the addition of NaOH. (A) Spectrum overlapping and emission intensity change at various water rates. (B) Intensity emission behavior using different DMSO:Water mixes at λEm maximum in each solvent. λEx = 399 nm; λEm 0% H2O = 456 nm; λEm 10% H2O = 458 nm; λEm 20% H2O = 480 nm; λEm 30% H2O = 487 nm; λEm 40% H2O = 488 nm; λEm 50% H2O = 488 nm; λEm 100% H2O = 489 nm; CC1 = 20 µM; CNaOH = 10 mol equivalents; solvent = DMSO. Image code: i: Iron (III) complex (C1) dissolved in DMSO. ii: Iron (III) complex (C1) dissolved in DMSO with NaOH 10 molar equivalents. iii: Iron (III) complex (C1) dissolved in DMSO:H2O: 9:1 with NaOH 10 molar equivalents. iv: Iron (III) complex (C1) dissolved in DMSO:H2O: 8:2 with NaOH molar equivalents. v: Iron (III) complex (C1) dissolved in DMSO:H2O: 7:3 with NaOH 10 molar equivalents. vi: Iron (III) complex (C1) dissolved in DMSO:H2O: 6:4 with NaOH 10 molar equivalents. vii: Iron (III) complex (C1) dissolved in DMSO:H2O: 5:5 with NaOH 10 molar equivalents. viii: Iron (III) complex (C1) dissolved in H2O with NaOH 10 molar equivalents.

