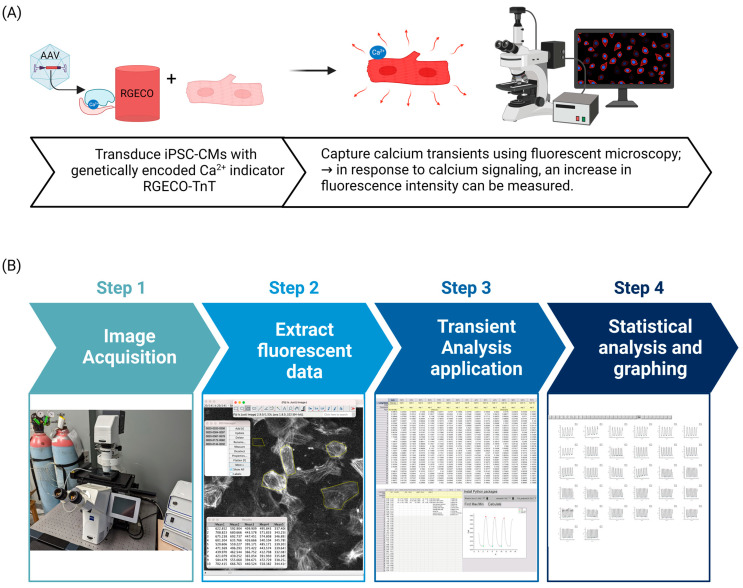
Figure 3.
Workflow for imaging and analysis of Ca2+ transient in hiPSC-CMs. (A) Once hiPSC-CMs are beating in culture, they can be transduced with AAV to deliver the RGECO-TnT biosensor. (B) With sufficient biosensor expression, hiPSC-CMs can be imaged. The fluorescence intensity of single cells can then be extracted using ImageJ software. These data can be imported into OriginPro software which can compute 11 features of calcium transients along with graphing and statistical analysis features.

