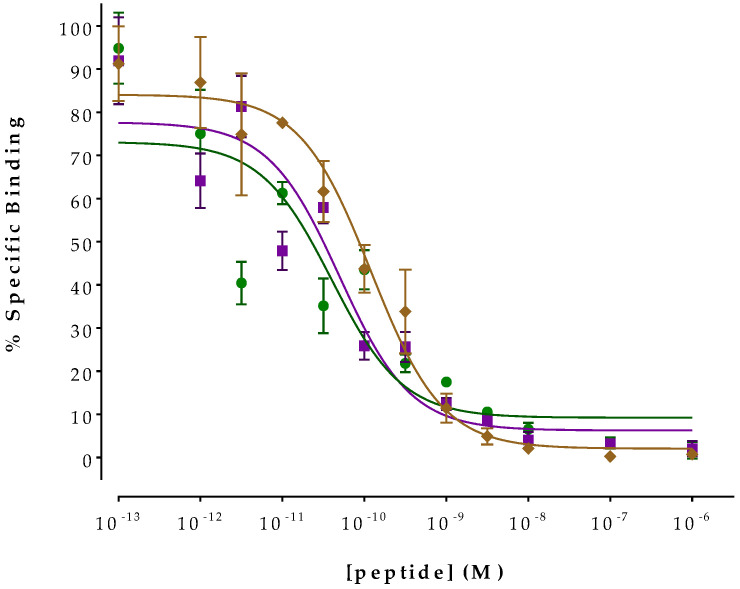
Figure 2.
Curves of [125I]I-Tyr3-NT displacement from NTS1R binding sites in WiDr cell membranes according to increasing concentrations of the following: DT10—green line (IC50 = 0.06 ± 0.03 nM, n = 3), DT11—violet line (IC50 = 0.08 ± 0.05 nM, n = 3) and DT12—brown line (IC50 = 0.10 ± 0.03 nM, n = 3); results represent mean IC50 values ± sd, n = number of separate experiments in triplicate.

