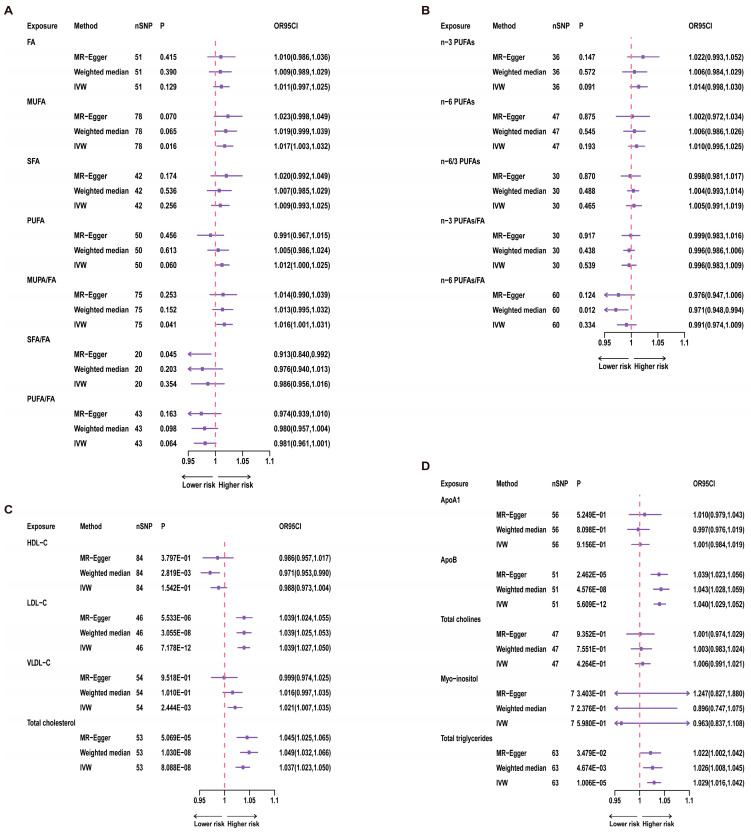
Figure 3.
Results of univariate MR for 21 Exposures and Telomere Length. A red dashed line in the figure represents the odds ratio (OR) value of 1. nSNP = number of SNP. (A) uvMR results for fatty acids and TL; (B) uvMR results of n-3 PUFAs and n-6 PUFAs and TL; (C) uvMR results for lipoprotein cholesterol and TL; (D) uvMR results for glycerophospholipids, glycerolipids and TL.

