FIGURE 5.

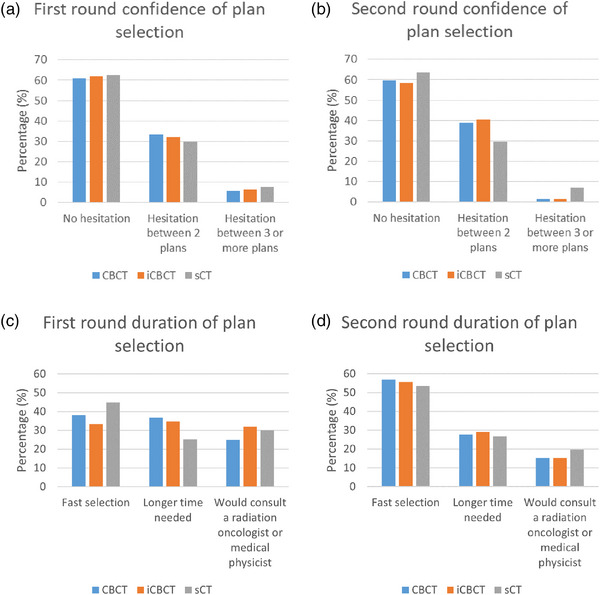
Bar plot confidence and duration of plan selection. Top row, the confidence of plan selection in the first and second round. On the bottom row, the level of duration of plan selection in the first and second round.

Bar plot confidence and duration of plan selection. Top row, the confidence of plan selection in the first and second round. On the bottom row, the level of duration of plan selection in the first and second round.