FIGURE 6.

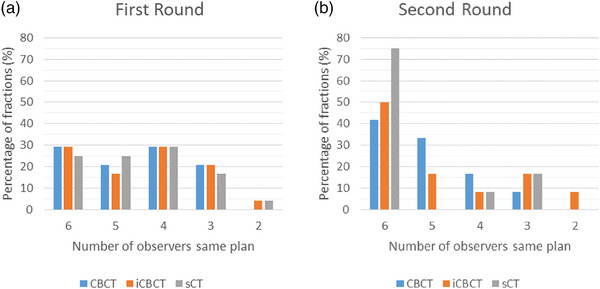
Barplot of plan selection agreement. The number of observers which selected the same plan. The colors indicate the three different image types, CBCT, iCBCT, and sCT.

Barplot of plan selection agreement. The number of observers which selected the same plan. The colors indicate the three different image types, CBCT, iCBCT, and sCT.