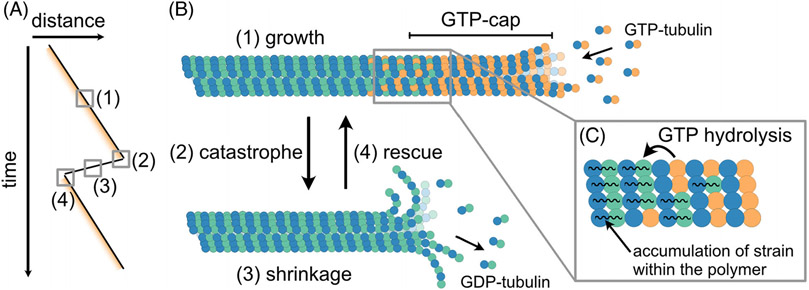
FIGURE 1.
Microtubule dynamics can be explained by the GTP-cap model. (A) A “kymograph” schematic of microtubule end position over time. Yellow shading represents the “GTP-cap.” Microtubule ends switch between phases of growth (1) and shrinkage (3) through transitions called “catastrophe” (2) and “rescue” (4). (B) Microtubules grow by the addition of GTP-tubulin heterodimers onto their ends. After incorporation into the microtubule polymer, GTP in the β-subunit of tubulin undergoes hydrolysis after a delay, leaving a “cap” of GTP-tubulin at the growing end. (C) GTP-hydrolysis induces a conformational change resulting in strain build-up within the GDP-polymer lattice (C). Loss of the protective GTP-cap from the microtubule end exposes the unstable GDP-tubulin lattice causing microtubule catastrophe – the switch into a phase of rapid microtubule shrinkage.

