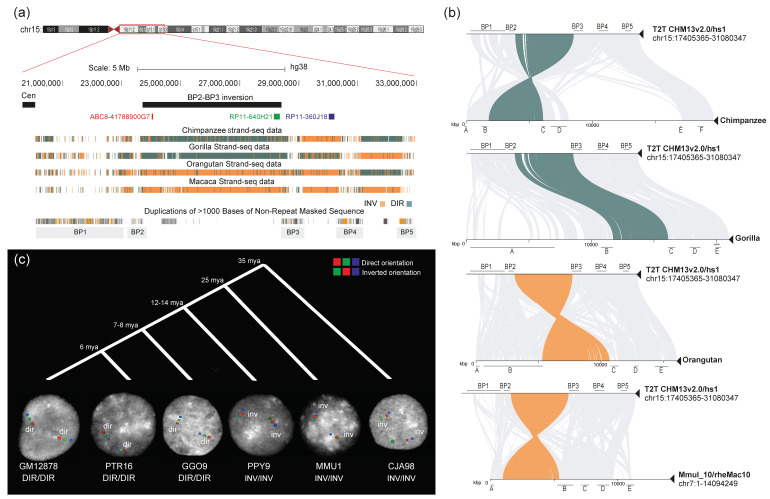
Figure 1.
BP2-BP3 inversion analysis. (a) UCSC Genome Browser view of the BP2-BP3 region in humans. The black bar represents the putative inversion; fosmid and BAC clones used for FISH experiments on interphase nuclei are indicated by red, green, and blue bars. Strand-seq data for chimpanzee, gorilla, orangutan, and macaque are reported, showing a direct orientation of the region for chimpanzee and gorilla and an inverted orientation for orangutan and macaque. (b) Minimiro sequence homology plots between humans and nonhuman primates (NHPs) for the 15q11-q13 region are depicted. Teal and orange lines connect the BP2-BP3 orthologous regions between humans and NHPs, in direct and inverted orientation, respectively. The remaining orthologous regions of the 15q11-13 locus are connected using gray lines. (c) FISH results on interphase nuclei for the BP2-BP3 inversion are shown for each analyzed species. The color order indicates probes’ relative orientation, with red–green–blue signals showing the direct orientation and green–red–blue signals showing inverted haplotypes. FISH analyses show that orangutan, macaque, and marmoset (outgroup) are all inverted when compared to the human reference genome orientation, while chimpanzee and gorilla are direct. The timing of species divergences is also shown at the top (mya = million years ago). GM12878 = Homo sapiens; PTR = Pan troglodytes; GGO = Gorilla gorilla; PPY = Pongo pygmaeus; MMU = Macaca mulatta; CJA = Callithrix jacchus.

