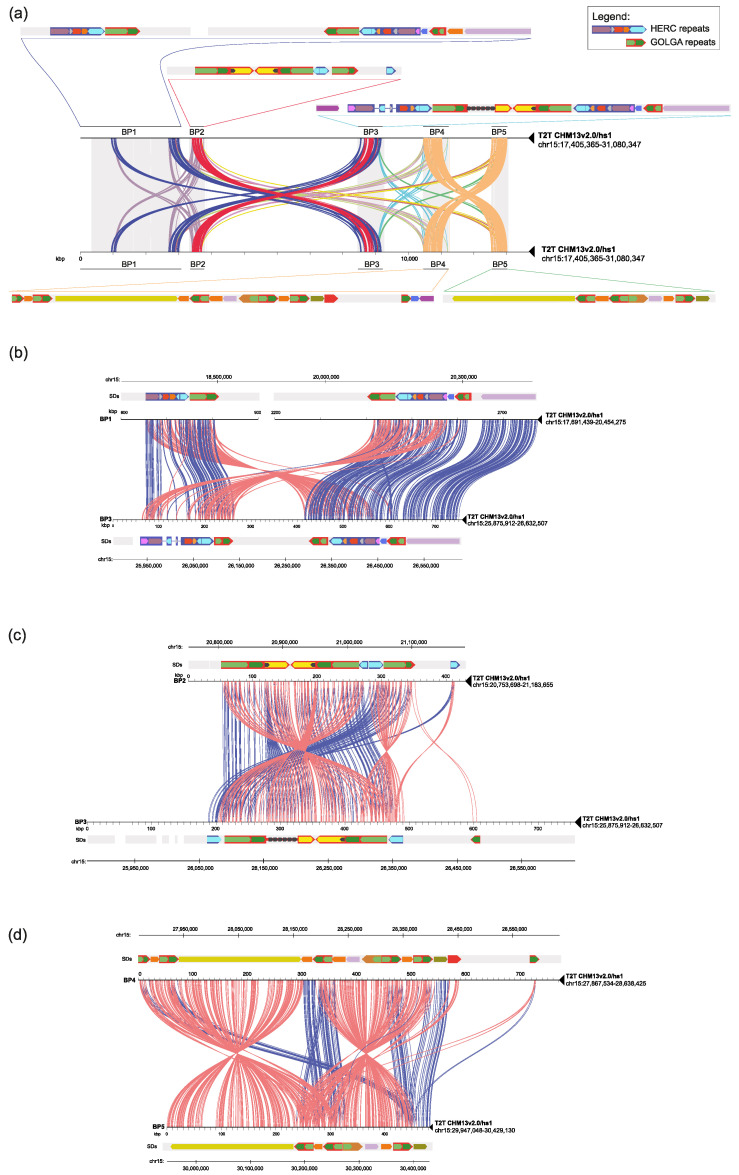
Figure 2.
Human sequence homology plots of the 15q11-13 region. (a) Minimiro comparison of the whole 15q11-13 human locus against itself (T2T CHM13v2.0/hs1). The five SD blocks involved in pathogenic rearrangements are depicted (BP1 to BP5). Colored lines connect paralogous SDs between different BPs. A detailed map of the SDs’ organization and their relative orientation is depicted for each BP. Larger arrows indicate duplication modules containing core duplicons widespread along the locus. (b) Minimiro comparison of BP1 versus BP3 highlights homologous SDs between them. Red and blue lines represent sequences showing a relative inverted and direct orientation between the two BPs, respectively. (c) Minimiro comparison of BP2 versus BP3 highlighting homologous SDs between the two BPs. Red lines represent sequences showing a relative inverted orientation between the two BPs, and blue lines a direct orientation. (d) Minimiro comparison of BP4 versus BP5 highlighting homologous SDs between the two BPs. Red lines represent sequences showing a relative inverted orientation between BP4 and BP5, and blue lines a direct orientation.

