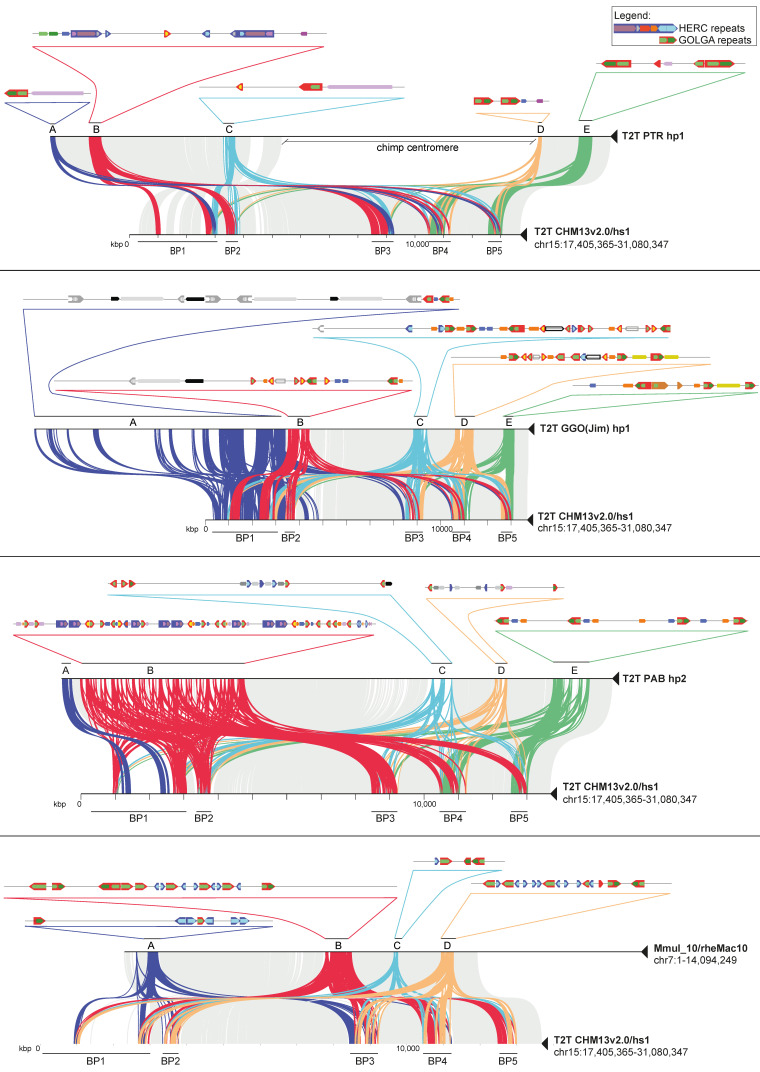
Figure 3.
Sequence homology plots of human versus nonhuman primates. Minimiro comparison of the whole 15q11-13 human locus against NHP orthologous regions. Gray lines connect syntenic single-copy regions, while colored lines represent matches between duplication blocks. For each NHP, the duplication blocks are labeled with letters A to E, where a detailed map of the SDs’ organization and their relative orientations are depicted. Larger arrows indicate duplication modules containing core duplicons widespread along the locus.

