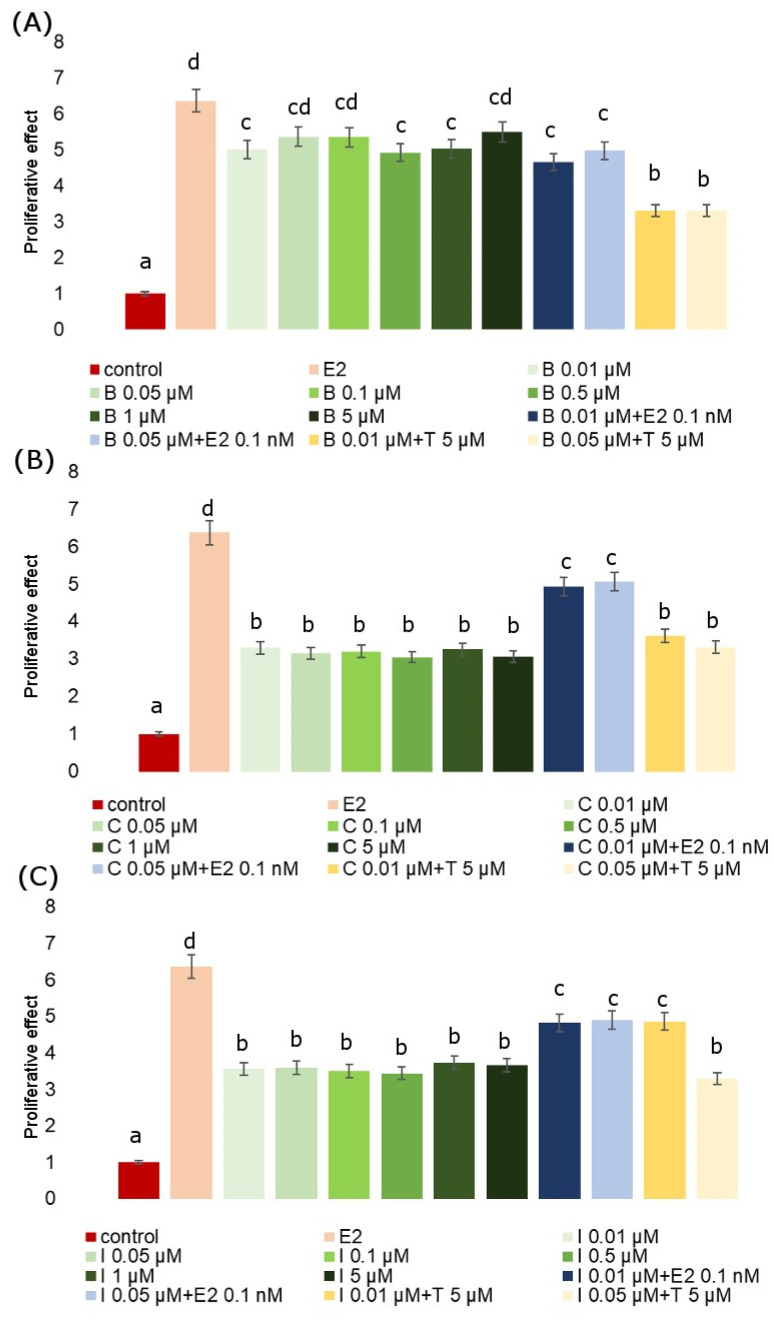
Figure 3.
E-screen assay. Maximum proliferative effects (PE) induced by B (A), C (B) and I (C) in MCF-7 cells. PE mean values of fungicide co-incubated with Tamoxifen (5 µM) and with E2 (0.1 nM). The values represent the means ± standard deviations. Different letters indicate statistical differences (p ≤ 0.05) between treatments estimated by Tukey’s test.

