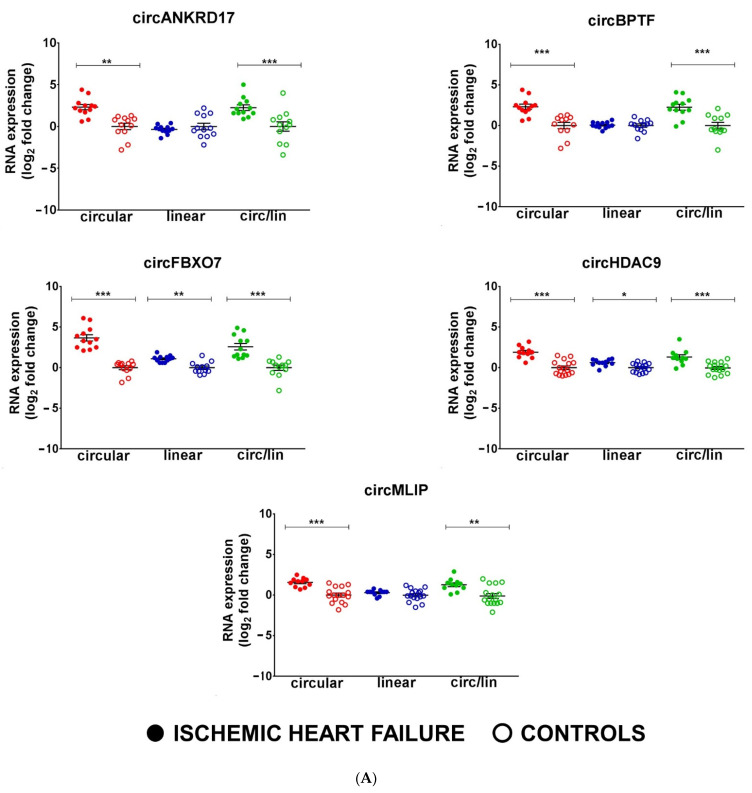
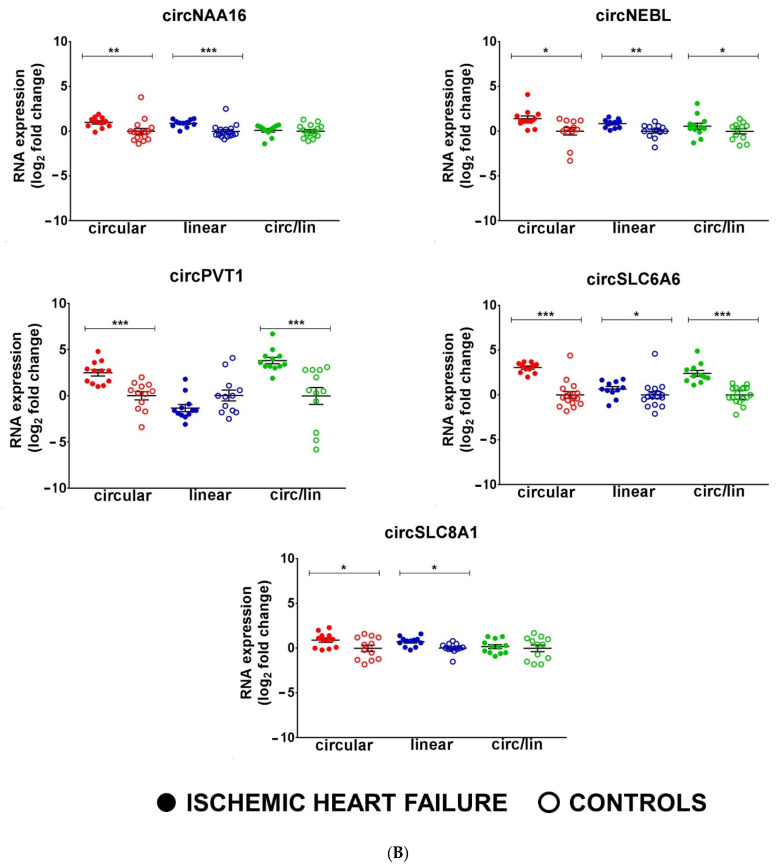
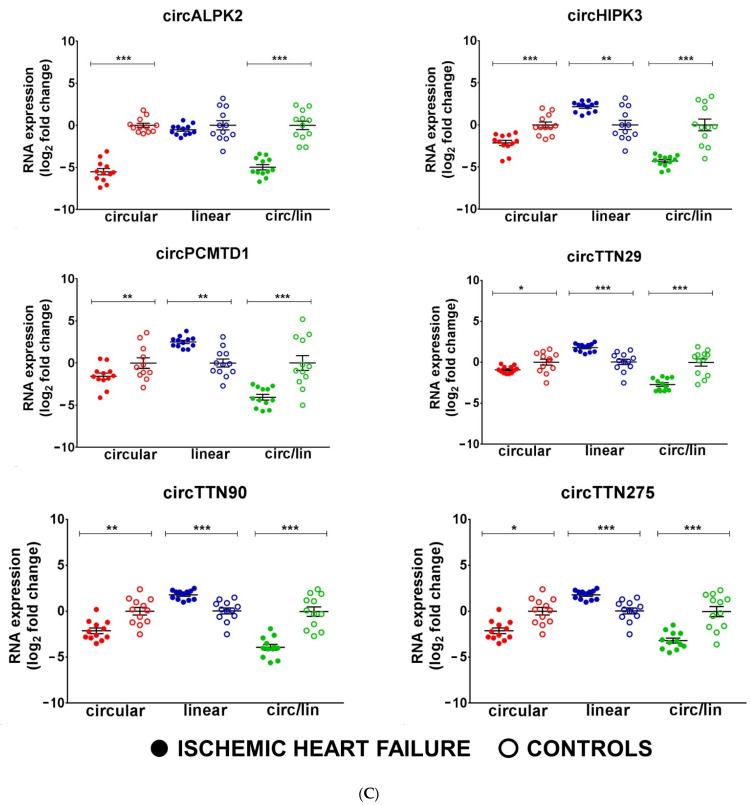
Figure 3.
circRNAs are deregulated in non-end-stage IHF patients. Total RNA was extracted from LV tissue from IHF patients (n = 12) and matched control subjects (n = 12). Dot-plots show circRNAs and host gene relative expression measured by qPCR and expressed as log2 fold change. The circ-to-linear ratio (circ/lin) indicates the circRNA enrichment compared to the host gene (linRNA). (A,B) show upregulated circRNAs, while (C) shows downregulated circRNAs. Mean values and error bars are indicated (* p < 0.05, ** p < 0.01, and *** p < 0.001).


