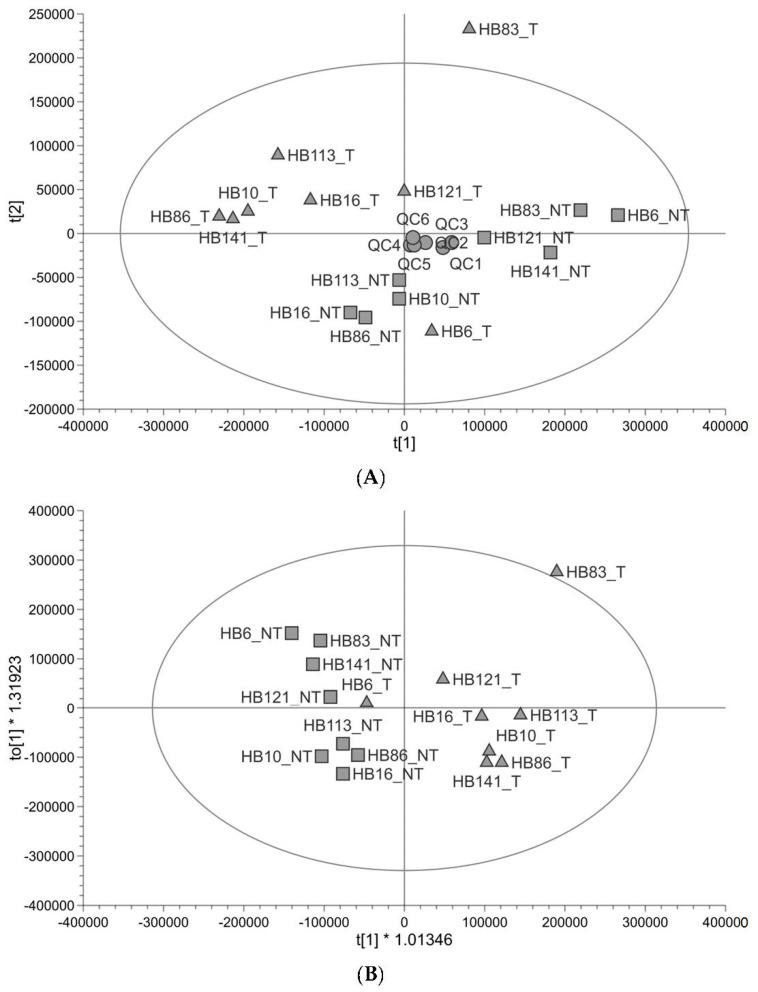
Figure 1.
Untargeted metabolite profiling in paired tumour and non-tumour tissue samples (n = 8). (A) PCA score plot showing hepatoblastoma (▲) and healthy liver (■) paired samples from paediatric patients alongside pooled QCs (●). (B) OPLS-DA score plot showing the same samples (R2Y 0.788, Q2 0.481).

