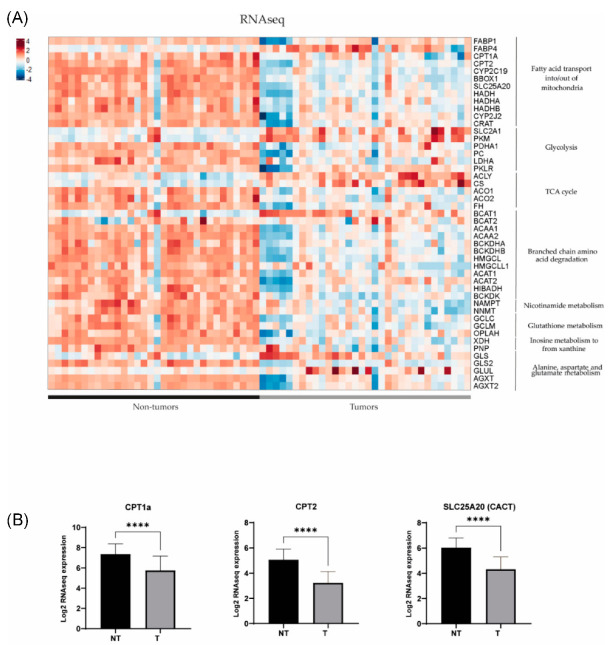
Figure 3.
(A) Gene expression differences assessed by RNAseq in key metabolic pathways in 32 tumour (T) and 32 non-tumour (NT) samples (data extracted from Carrillo-Reixach et al. [11]). (B) Differences in the expression of CPT1a, CPT2 and SLC25A20 (CACT) in tumours in comparison with non-tumours. p-values were calculated using unpaired t-tests. **** p < 0.0001.

